 Analysis Explained: How to Calculate, Apply in Financial Models, and Maximize Benefits")
Year-over-Year (YoY) analysis is an essential tool for assessing a company’s financial performance over time. By comparing data from one period (usually a year) to the same period in the previous year, YoY analysis helps identify trends, growth patterns, and potential areas for improvement. It’s a key metric in evaluating revenue growth, business performance, and financial health. This guide will explain how YoY analysis works, show you how to calculate it, discuss how it fits into financial models, and share how you can maximize its benefits.
What is Year-Over-Year (YoY) Analysis?
YoY analysis involves comparing the performance of a financial metric (such as revenue, net income, or operating income) from the current year to the same period in the previous year. This method provides valuable insights into growth, seasonality, and overall financial health. It helps businesses and investors understand how the company is performing compared to the previous year, providing clarity on growth patterns and potential risks. By tracking YoY performance, businesses can evaluate whether growth is consistent or fluctuating, and investors can gauge whether a stock or asset is performing well.
One of the key advantages of YoY analysis is its ability to eliminate the impact of seasonality. For example, retail businesses may see higher sales during the holiday season, but by comparing YoY data, you can better assess whether that growth is part of a long-term trend or just a seasonal bump.
How to Calculate YoY Growth
Calculating YoY growth is straightforward. The formula used to determine YoY growth is:

For example, let’s say a company’s revenue increased from $10 million last year to $12 million this year. Using the formula, the YoY growth would be calculated as follows:

This means the company’s revenue grew by 20% compared to the same period last year, indicating positive growth. A positive YoY growth suggests that the company is performing well, while a negative YoY growth could indicate a decline in performance, which would require further analysis.
When applying YoY to different metrics, such as operating income, net income, or EBITDA, the formula remains the same. By calculating YoY growth for multiple metrics, businesses can gain a more comprehensive understanding of their financial performance.
Applications of YoY in Financial Models
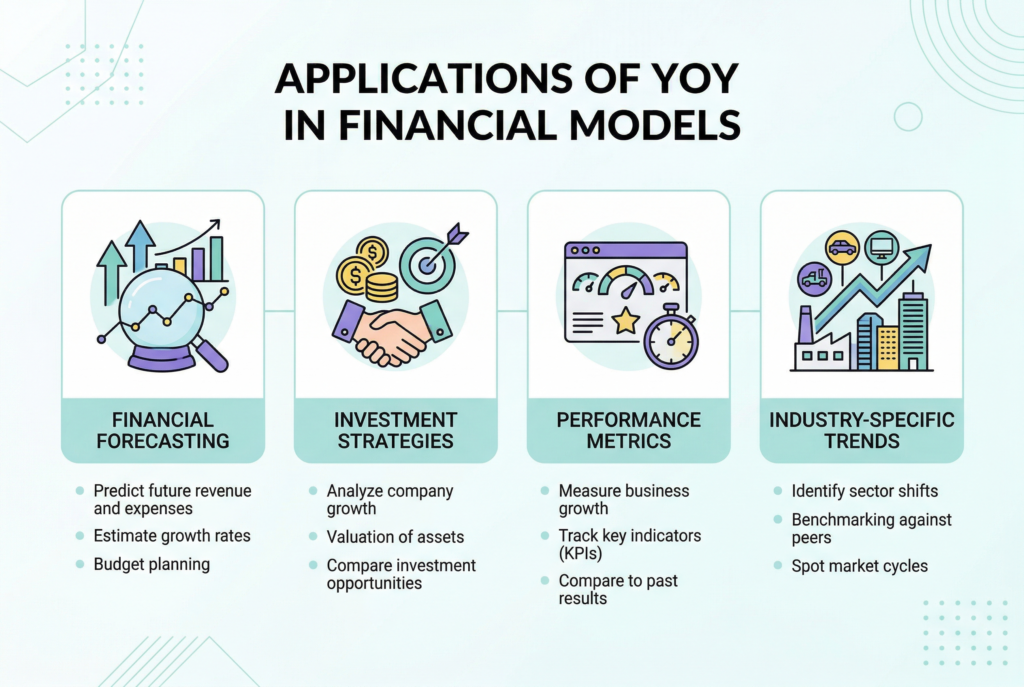
Financial Forecasting
YoY growth is frequently used in financial forecasting, which is crucial for projecting future revenue, expenses, and profits. By analyzing YoY trends, businesses can identify long-term growth patterns and use this information to create more accurate projections. For example, if a company’s YoY revenue growth has been consistently positive, they may forecast continued growth in the future, allowing them to plan resources and investments accordingly.
Investment Strategies
Investors rely heavily on YoY analysis to assess the health and potential of companies. By looking at YoY growth rates, investors can determine whether a company is growing at a sustainable rate or experiencing volatility. For instance, if a company’s revenue growth is consistently strong YoY, investors might view it as a stable and profitable investment. On the other hand, if YoY growth is declining, it might raise concerns about the company’s future prospects.
Performance Metrics
YoY growth is often used to track key performance indicators (KPIs) such as revenue, operating income, or net income. By comparing these metrics year-over-year, businesses can assess how effectively they’re meeting their financial goals. Positive YoY growth indicates that the company is achieving its targets, while negative growth suggests areas that need improvement. Additionally, comparing YoY performance against industry averages or competitors can help businesses identify areas for improvement and competitive advantages.
Industry-Specific Trends
YoY analysis is especially useful in industries that experience significant seasonal fluctuations, such as retail or agriculture. By comparing data from the same period in the previous year, businesses in these sectors can better account for seasonal variations in sales or performance. For example, a retailer may experience a spike in sales during the holiday season, but by comparing YoY data, they can determine whether that increase is part of a larger trend or just a temporary seasonal effect.
Maximizing the Benefits of YoY Analysis

Adjust for Seasonality
Many industries experience seasonal fluctuations in performance. For example, retailers see higher sales during the holidays, and agriculture businesses see peaks during harvest seasons. To account for these fluctuations, it’s essential to adjust YoY analysis to focus on like-for-like comparisons. By doing this, you can get a clearer picture of the company’s long-term growth potential.
Include Multiple Metrics
While YoY revenue growth is often the most commonly analyzed metric, it’s important to consider other financial indicators as well. This could include net income, operating income, EBITDA, and other KPIs relevant to your business or investment. By examining multiple metrics, you can better understand the overall financial health of the company and how different areas of the business are performing.
Visualize Data

One of the most effective ways to understand YoY trends is by visualizing the data in graphs or charts. Visual aids allow you to see changes over time, identify growth patterns, and pinpoint areas that require attention. Whether you’re presenting the data to investors or using it for internal analysis, visual representations of YoY data can help make complex information easier to interpret.
Consider Market Conditions
YoY analysis is not without its limitations. While it’s a valuable metric, YoY growth can be misleading if external factors, such as inflation or market volatility, aren’t considered. For example, a 10% YoY increase in revenue might look impressive, but if inflation is running at 8%, the real growth is only 2%. To get a more accurate picture, always contextualize YoY growth with market conditions and external factors.
Common Pitfalls in YoY Analysis
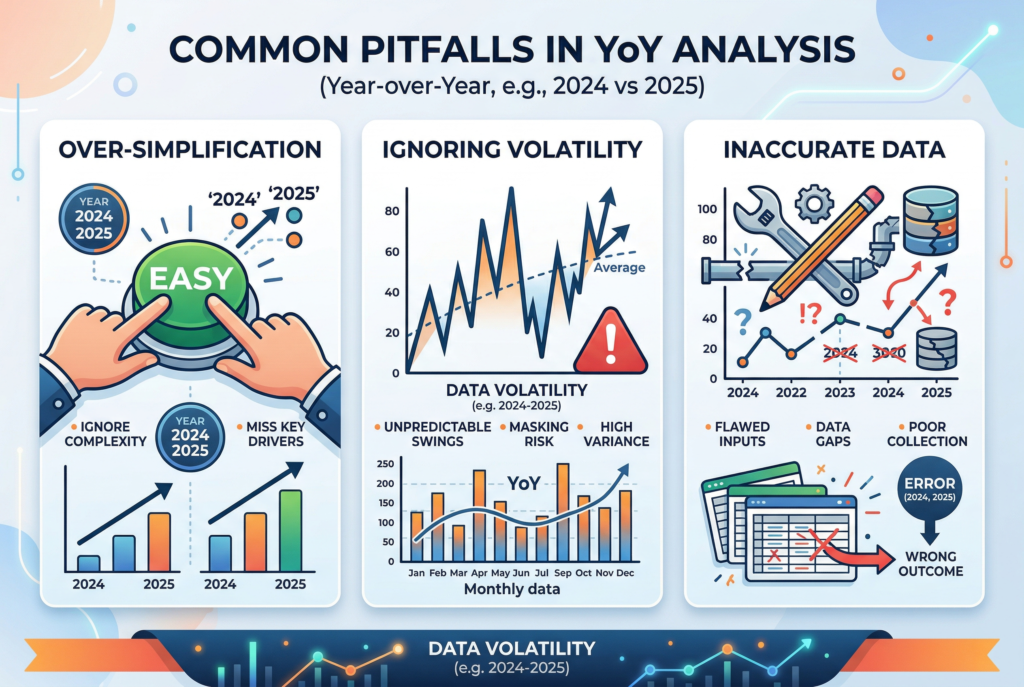
Over-Simplification
While YoY is a great way to measure growth, it can oversimplify a company’s performance if you focus only on a single metric. YoY growth is best used as part of a larger financial analysis, including other metrics and factors that can provide a more comprehensive view of the company’s health.
Ignoring Volatility
YoY growth doesn’t account for volatility, which can significantly affect performance in some industries. For example, companies in volatile sectors like tech or energy may see large swings in YoY growth due to external factors. It’s important to assess whether the YoY growth is part of a consistent trend or just a result of short-term fluctuations.
Inaccurate Data
YoY analysis relies on accurate and consistent data. If the data is inconsistent or unreliable, your YoY analysis could be misleading. Always ensure the data you’re comparing is from reputable sources and has been adjusted for any anomalies or discrepancies.
Conclusion: Making YoY Work for You
YoY analysis is a powerful tool for measuring business performance and making informed investment decisions. Whether you’re forecasting future growth, assessing a company’s financial health, or making long-term investment decisions, YoY analysis provides valuable insights that can guide your strategy. By understanding how to calculate YoY growth, applying it to various financial models, and following best practices, you can maximize the benefits of this powerful metric.
Remember, YoY analysis is just one piece of the puzzle. To gain a comprehensive understanding of a company’s performance, it’s essential to consider multiple metrics, account for external factors, and adjust for seasonality. By doing so, you’ll be equipped to make more informed, data-driven decisions that drive business success and investment returns.