 Ratio Explained: How It Works, Formula, and Why It Matters for Investors")
The Price-to-Earnings (P/E) ratio is a fundamental metric used in stock analysis to evaluate the valuation of a company’s stock. Whether you’re an experienced investor or just getting started, understanding how to interpret the P/E ratio is essential for making informed investment decisions. This article will break down the P/E ratio in detail, explain how it’s calculated, and explore its importance and limitations. We’ll also delve into how investors use the P/E ratio to assess stock performance and make investment choices.
What is the P/E Ratio?
The Price-to-Earnings (P/E) ratio is a financial metric that compares a company’s current share price to its earnings per share (EPS). Essentially, it tells you how much investors are willing to pay for each dollar of earnings. The P/E ratio is a useful tool for evaluating stock valuation, as it helps determine whether a stock is overvalued, undervalued, or fairly priced relative to its earnings.
For example, if a company has a stock price of $100 and its EPS is $5, its P/E ratio would be 20 ($100 ÷ $5). This means investors are willing to pay $20 for every dollar of earnings the company generates.
How to Calculate the P/E Ratio
The formula for calculating the P/E ratio is simple:

Here’s an example: Imagine Company A has a stock price of $120 and earnings per share of $6. The P/E ratio would be:

This tells investors that the market is valuing each dollar of Company A’s earnings at $20. Comparing this P/E ratio to the industry average, or to competitors, can help investors decide if the stock is overvalued or undervalued.
Different Types of P/E Ratios
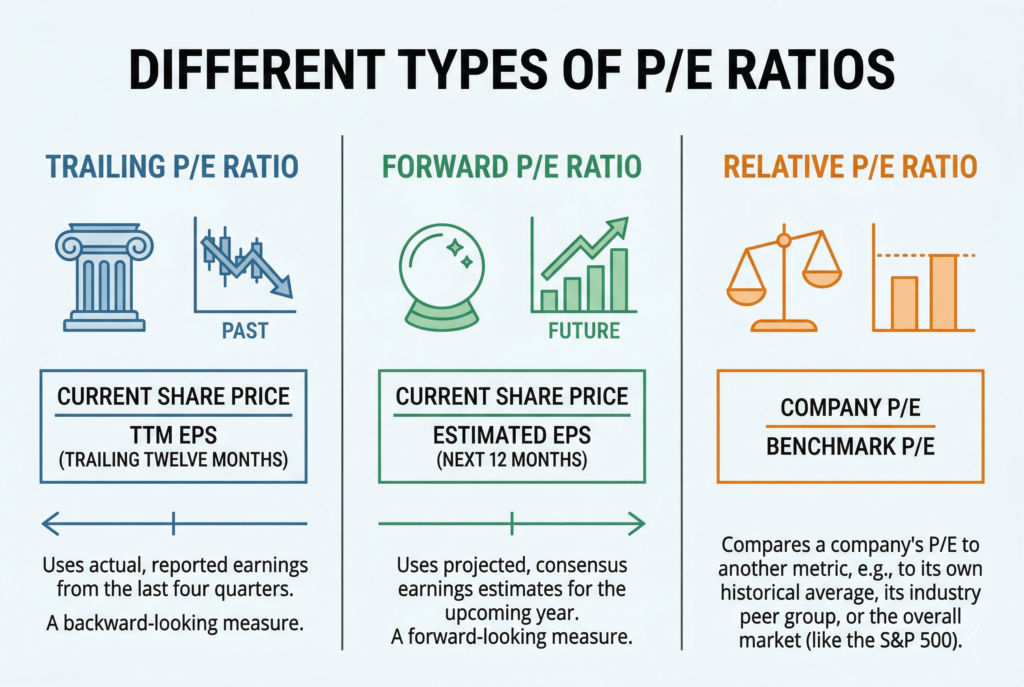
Trailing P/E Ratio
The trailing P/E ratio uses earnings from the past 12 months (or the most recent four quarters) to calculate the ratio. It’s the most commonly used version of the P/E ratio because it reflects actual historical performance. However, trailing P/E ratios may not always provide an accurate reflection of a company’s future potential, especially in fast-growing industries where future earnings might be much higher.
For instance, a company might have a low trailing P/E ratio due to a temporary drop in earnings, but its future earnings could be much stronger, making it an attractive investment.
Forward P/E Ratio
The forward P/E ratio uses projected earnings for the next 12 months. This version of the P/E ratio gives investors a forward-looking view of the company’s expected growth. It is particularly useful when evaluating companies in growth sectors, as it reflects future expectations rather than historical performance. However, projections are often based on analysts’ estimates, and if those projections are inaccurate, the forward P/E ratio could lead investors astray.
Relative P/E Ratio
The relative P/E ratio compares a company’s P/E ratio with the average P/E ratio of the market or its industry peers. This helps investors assess whether a stock is overvalued or undervalued compared to similar companies. For example, if the average P/E ratio for a tech company is 30, and Company A’s P/E ratio is 45, it may suggest that Company A is overvalued. However, if its growth prospects justify this premium, the higher P/E might be justified.
Why the P/E Ratio Matters for Investors
The P/E ratio is an important tool for stock valuation, offering insights into how much investors are willing to pay for a company’s earnings. Understanding the significance of the P/E ratio can help investors make more informed decisions about which stocks to buy or sell.
Valuation of Stocks
One of the primary reasons investors use the P/E ratio is to evaluate whether a stock is overvalued or undervalued. A high P/E ratio often indicates that investors expect strong future growth, but it can also mean the stock is overpriced. Conversely, a low P/E ratio could suggest that a stock is undervalued or facing difficulties, but it might also signal an opportunity to buy a potentially undervalued stock.
For example, growth stocks in fast-growing industries like technology tend to have high P/E ratios, while value stocks, like those in more stable industries, often have lower P/E ratios. Understanding this context can help investors choose stocks based on their risk tolerance and investment goals.
Market Sentiment
The P/E ratio provides insight into investor sentiment. A company with a high P/E ratio may indicate that investors are optimistic about its future growth potential. Conversely, a low P/E ratio might indicate that the market is skeptical about the company’s ability to grow or recover. Understanding the sentiment behind a company’s P/E ratio can help investors make decisions about entering or exiting a stock position.
Comparing Stocks
Investors often use the P/E ratio to compare stocks within the same industry or sector. For example, comparing the P/E ratio of two companies in the same sector helps investors assess which one is more fairly valued. If one company has a much higher P/E ratio, it might indicate overvaluation, while a lower P/E might indicate that the company is undervalued or experiencing challenges.

Limitations of the P/E Ratio
While the P/E ratio is a valuable tool for investors, it has limitations that should be kept in mind. It’s essential to not rely solely on the P/E ratio when making investment decisions.
Does Not Account for Growth
The P/E ratio alone doesn’t provide information about the company’s future growth. A high P/E ratio could be justified if the company is expected to grow rapidly, but it could also be a red flag if the company’s future earnings growth is uncertain. That’s why investors often use other metrics like the PEG ratio (Price/Earnings-to-Growth ratio) to assess whether a stock’s high P/E is justified by its growth prospects.
Limited Use Across Different Industries
The P/E ratio isn’t universally applicable across all industries. For example, high-growth sectors like technology and biotech often have higher P/E ratios than more stable industries like utilities or consumer goods. Comparing the P/E ratios of companies in different industries without considering these differences can lead to misleading conclusions.
Can Be Misleading for Companies with Negative Earnings
If a company has negative earnings, its P/E ratio will be negative or undefined. In such cases, the P/E ratio becomes irrelevant, and investors should look at other financial metrics like revenue growth or operating cash flow to assess the company’s financial health.
How to Use the P/E Ratio in Investment Decisions
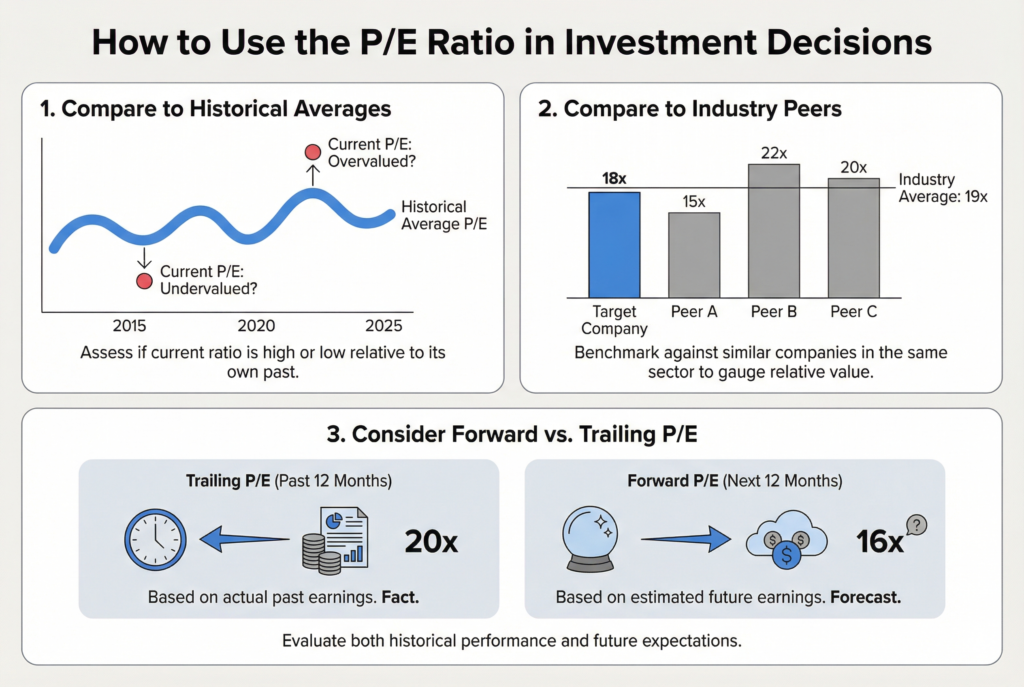
1. Compare to Historical Averages
Compare the P/E ratio of a company to its historical P/E ratio. If the current P/E ratio is higher than the historical average, it might indicate that the stock is overvalued, unless the company’s future growth justifies the premium. Conversely, a lower P/E ratio may suggest an opportunity if the company’s fundamentals are strong.
2. Compare to Industry Peers
When evaluating stocks, it’s essential to compare a company’s P/E ratio to other companies in the same industry. Industry norms can provide valuable context. For example, if the average P/E ratio for a sector is 25, and a particular company has a P/E of 35, it might be considered overvalued unless there is a strong growth rationale.
3. Consider Forward vs. Trailing P/E
Using both the trailing P/E and forward P/E ratios allows investors to evaluate both historical performance and future growth expectations. A company with a high trailing P/E ratio might not be as concerning if the forward P/E indicates strong earnings growth.
Conclusion
The Price-to-Earnings (P/E) ratio is a powerful tool for evaluating stock prices and assessing a company’s valuation. It helps investors determine whether a stock is overvalued or undervalued relative to its earnings, providing insights into market sentiment and future growth expectations. However, the P/E ratio should always be considered alongside other financial metrics, industry comparisons, and market conditions.
By understanding how to calculate and interpret the P/E ratio, investors can make more informed decisions and enhance their investment strategies. Always remember to look beyond the P/E ratio and consider a company’s growth potential, industry position, and future earnings before making your investment decision.