
The Cup and Handle pattern is a highly regarded technical analysis tool used by traders to identify strong bullish continuation signals. This chart pattern has become a staple in stock market analysis, especially for predicting upward breakouts after a period of consolidation. Whether you’re an experienced trader or just starting, mastering this pattern can greatly improve your ability to make profitable trades.
In this comprehensive guide, we’ll explain what the Cup and Handle pattern is, how to identify it, how to effectively trade using this pattern, and how to maximize your gains while managing risks. You’ll also learn about important volume trends, the best timeframes to apply the pattern, and potential pitfalls to avoid.
What is the Cup and Handle Pattern?
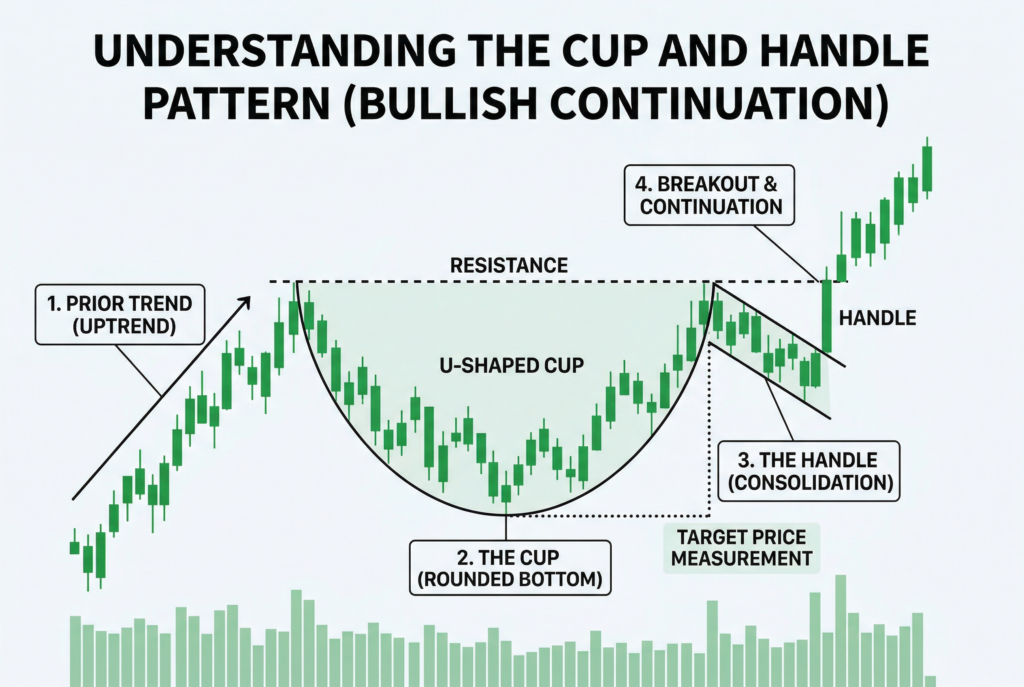
The Cup and Handle pattern is a technical chart formation that signals the continuation of an existing bullish trend. It consists of two main phases: the cup, which is a U-shaped consolidation, and the handle, which is a smaller pullback or consolidation forming right after the cup. When the price breaks above the resistance formed by the handle, it’s seen as a strong indicator that the upward trend will continue.
The pattern is typically formed after an extended uptrend, where the price experiences a period of consolidation. During this consolidation, the price starts to drop but then begins to recover, forming a rounded, U-shaped bottom. Once the cup has completed, the price experiences a small pullback or sideways movement, known as the handle. The breakout occurs when the price breaks above the resistance level formed by the handle, signaling the continuation of the upward trend.
This pattern is particularly useful for identifying bullish entry points, making it a favorite among traders looking for confirmation of a strong continuation in the market.
How to Identify the Cup and Handle Pattern
Identifying the Cup and Handle pattern is critical for successful trading. The first step is to spot the formation of the cup. The cup must be U-shaped, with a rounded bottom, indicating a period of consolidation and recovery after a previous rally. Ideally, the cup shouldn’t be too deep, as a deeper cup might suggest a weaker bullish trend. The depth of the cup shouldn’t retrace more than 50% of the previous price move.
After the cup forms, the handle begins to take shape. This is usually a smaller pullback or consolidation phase, often taking the form of a slight downward or sideways movement. The handle should form in the top half of the cup, ensuring that it doesn’t get too deep. A shallow handle is more ideal, as it indicates the market is ready to break higher after a brief period of consolidation.
One of the most important factors in confirming the validity of the pattern is volume. During the formation of the cup, the volume should gradually decline as the price consolidates. When the breakout occurs above the handle’s resistance level, volume should spike. This volume surge acts as confirmation that the breakout is legitimate and that the bullish trend is likely to continue.
How to Trade the Cup and Handle Pattern
Identifying the Entry Point
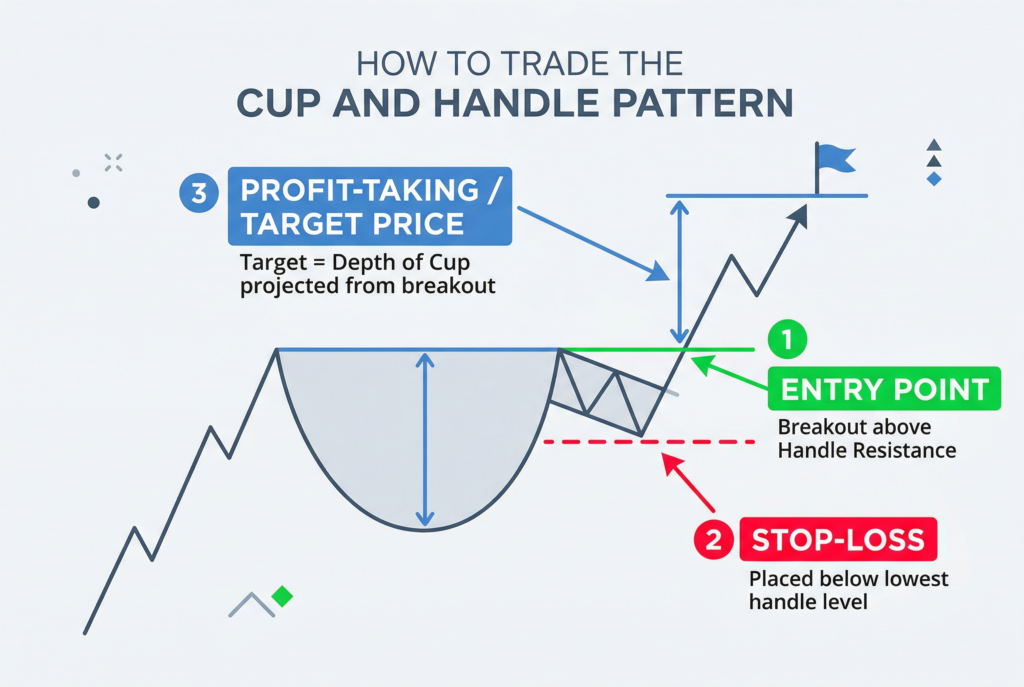
The ideal entry point occurs when the price breaks above the resistance level formed by the handle. To capitalize on this breakout, you should place a stop-buy order just above the resistance. This ensures that you enter the trade as soon as the price confirms the breakout, reducing the chances of missing out on the trade.
It’s important to wait for the confirmation of the breakout before entering the trade. A close above the resistance level, accompanied by a surge in volume, is a clear signal that the price is likely to continue rising.
Setting the Stop-Loss
Proper risk management is essential when trading with the Cup and Handle pattern. To minimize potential losses, place a stop-loss order just below the lowest point of the handle. This helps protect your position in case the breakout fails or the market reverses.
If the price falls back below the handle’s low, this may indicate a failed breakout or a reversal in the trend. Exiting the trade at this point will help you limit your losses and prevent them from growing.
Profit-Taking and Target Price
To calculate the target price for your trade, measure the distance from the bottom of the cup to the resistance level. Add this same distance to the breakout price to determine your target. For example, if the cup’s bottom is at $100 and the resistance level is at $120, the target price would be $140 ($120 + $20).
It’s important to be patient and let the trade develop. As the price moves toward the target, keep an eye on volume trends and market conditions to ensure the trade is still valid. If the price reaches the target or shows signs of exhaustion, consider taking profits or adjusting the stop-loss to lock in gains.
Best Timeframes to Use the Cup and Handle Pattern

The Cup and Handle pattern is most reliable on longer timeframes, such as daily or weekly charts. These timeframes allow for a clearer view of the market trend and reduce the likelihood of false breakouts. Shorter timeframes, such as 15-minute or hourly charts, may result in more noise and less reliable patterns.
For longer-term traders, using the daily or weekly chart gives the pattern enough time to develop fully and provides a more reliable signal. Short-term traders might still find success with the pattern on intraday charts, but they should be extra cautious of market noise.
Volume and Its Role in Confirming the Pattern
Volume plays a crucial role in validating the Cup and Handle pattern. As mentioned earlier, the volume should decline during the formation of the cup, reflecting the period of consolidation. However, once the price breaks above the handle’s resistance, volume should increase significantly, indicating strong buying interest and the likelihood of a sustained upward trend.
A low volume breakout can be a red flag, suggesting that the breakout may lack the momentum to continue. Always ensure that volume confirms the pattern before entering the trade to avoid false breakouts and minimize risk.
Common Mistakes to Avoid
While the Cup and Handle pattern is a reliable chart formation, it’s not foolproof. There are several common mistakes traders make when using this pattern:
- Entering too early: A common mistake is entering the trade before the breakout is confirmed. Waiting for the price to close above the resistance level and for volume to surge is crucial to ensuring the breakout is valid.
- Overlooking the handle depth: A handle that is too deep or too long can weaken the pattern. A deep handle might signal that the market is experiencing too much resistance, making the breakout less likely to succeed.
- Ignoring volume: Volume is essential in confirming the breakout. If the volume doesn’t increase significantly when the price breaks the resistance level, the breakout may not be sustainable.
- Disregarding market conditions: The Cup and Handle pattern works best in trending markets. Applying it in a sideways or highly volatile market can lead to false signals and poor trades.
Real-World Example: Wynn Resorts

Let’s consider a practical example using Wynn Resorts stock. Suppose that the price has been rising steadily, and then it starts to form the cup. After the recovery, the price enters a consolidation phase, forming the handle. When the stock breaks through the handle’s resistance with a surge in volume, this confirms the Cup and Handle pattern. Based on the calculated target price and the validated breakout, traders would enter a buy order and set their stop-loss below the handle’s low.
In this case, the price movement aligns perfectly with the Cup and Handle pattern, resulting in a profitable trade. By using volume confirmation and proper risk management strategies, traders can significantly improve their chances of success.
Conclusion: Mastering the Cup and Handle Pattern
The Cup and Handle pattern is an invaluable tool for traders looking to identify bullish continuation signals. By understanding how to identify the pattern, apply proper entry and exit strategies, and manage risk effectively, you can enhance your trading success. However, it’s essential to remember that no pattern is foolproof, and confirming the breakout with volume trends is crucial for minimizing false signals.
For those looking to capitalize on long-term trends, the Cup and Handle pattern offers a structured and reliable way to enter the market. By following the steps outlined in this guide, you can maximize your gains while minimizing potential risks.