

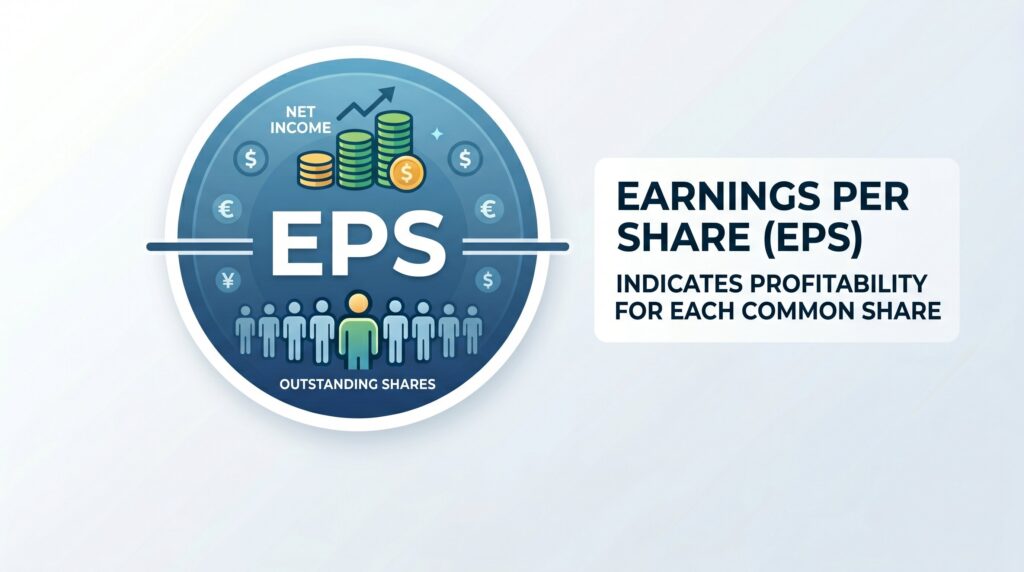
You can look up a company’s EPS on most finance platforms, but learning the earnings per share formula helps you understand what that number really means. If you want to know how to calculate earnings per share, you need to look beyond the headline figure and see how net income, preferred dividends, and share count work together. EPS is one of the first numbers investors use to judge profitability, but it’s most useful when you know how it’s built.
What is EPS? The Bottom Line of Profitability
What is EPS? EPS means earnings per share, which is the portion of a company’s profit allocated to each outstanding share of common stock. A simple EPS definition is this: EPS shows how much profit a company earns for every common share investors own.
The EPS meaning is important because total profit alone doesn’t tell the whole story. A company may earn billions of dollars, but if it has a very large number of shares outstanding, each share may represent only a small portion of those earnings. EPS turns company profit into a per share number, making it easier to compare profitability over time. For investors, earnings per share is a starting point. It helps answer a basic question: is the company becoming more profitable for each share owned?
The EPS Formula: Basic vs. Diluted
The basic EPS formula is:
This formula focuses on common shareholders. Preferred dividends are subtracted because preferred shareholders get paid before common shareholders. After that, the remaining earnings belong to common shares.
Diluted EPS uses a more cautious version of the formula:
Diluted EPS includes potential shares from stock options, convertible bonds, warrants, restricted stock units, and other securities that may become common shares. Because diluted EPS uses a larger share count, it’s usually lower than basic EPS.
This matters because diluted EPS shows a more conservative view of profitability. It answers the question: what would earnings per share look like if all possible shares were created? For companies with heavy stock based compensation or convertible securities, diluted EPS can reveal risks that basic EPS hides.
How to Calculate Earnings Per Share in 4 Steps
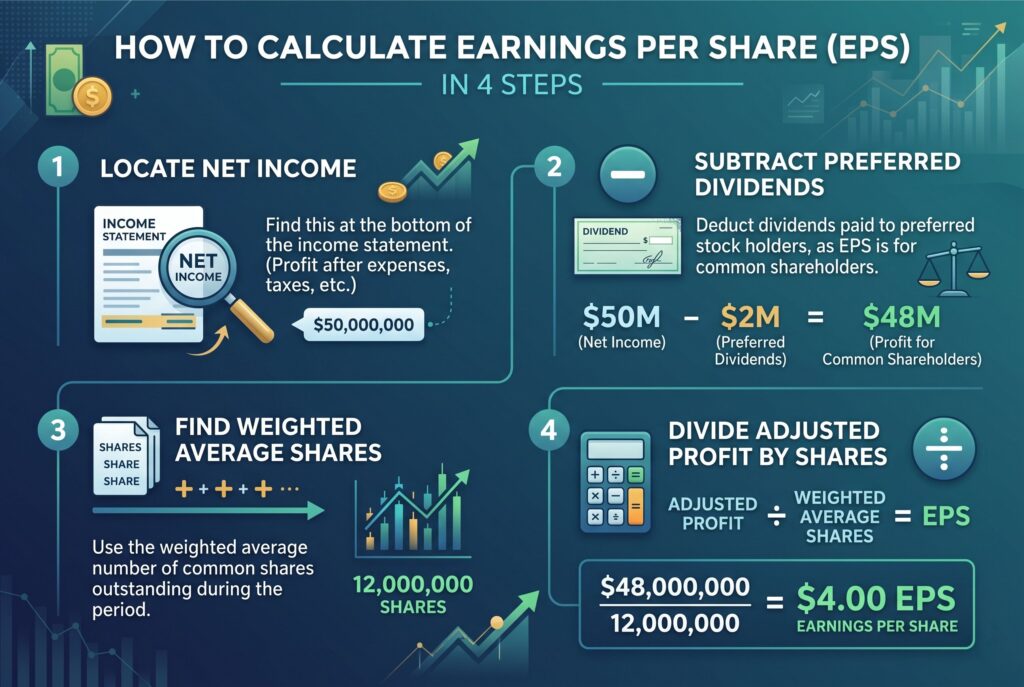
The first step is to locate net income. You’ll usually find this near the bottom of the income statement. Net income is the company’s profit after expenses, interest, taxes, and other costs.
The second step is to subtract preferred dividends, if the company has preferred stock. This matters because EPS is mainly about common shareholders. Since preferred shareholders are paid first, their dividends shouldn’t be counted as profit available to common shareholders.
The third step is to find the weighted average shares outstanding. This number is often shown in the company’s earnings report or financial statements. Weighted average shares are more accurate than a simple end of period share count because companies may issue or buy back shares during the year.
The fourth step is to divide adjusted profit by shares outstanding. For example, imagine a company reports $50 million in net income, pays $2 million in preferred dividends, and has 12 million weighted average common shares. The calculation would be:
That means the company earned $4 for each common share during the period.
Interactive EPS Calculator
Interactive EPS Calculator
Enter net income, preferred dividends, and weighted average common shares outstanding. The calculator will automatically calculate earnings per share and show what drives the result.
EPS = (Net Income − Preferred Dividends) ÷ Weighted Average Common Shares Outstanding
An interactive EPS calculator should help users run the math instantly. The calculator only needs three inputs: net income, preferred dividends, and weighted average common shares outstanding. The user enters net income first. Then they enter preferred dividends. Finally, they enter shares outstanding. The calculator subtracts preferred dividends from net income, divides the result by shares, and displays earnings per share.
This kind of tool is useful because small changes can create big differences. If net income rises but share count also rises, EPS may not grow much. If net income stays flat but the company buys back shares, EPS can increase even though the business didn't actually earn more total profit. That’s why a calculator shouldn’t only show the final EPS. It should help investors understand what caused the number to move.
Real-World Example: Calculating a Tech Giant’s EPS
Let’s use a realistic tech company example. Suppose a large technology company reports $100 billion in net income. It doesn't pay preferred dividends, and it has 15 billion weighted average common shares outstanding.
Using the earnings per share formula:
This means each common share represents $6.67 of annual profit.
Now imagine the same company earns $100 billion again the next year, but it reduces its share count to 14 billion through buybacks. EPS becomes:
At first glance, EPS growth looks positive. But net income didn't increase. The improvement came from fewer shares, not stronger business performance. This is why investors should always compare EPS growth with total net income growth.
Why EPS Matters: The P/E Ratio Connection
Earnings per share by itself doesn't tell you whether a stock is cheap or expensive. To understand valuation, investors often connect EPS to the price to earnings ratio, also called the P/E ratio.
If a stock trades at $80 and its EPS is $4, the P/E ratio is 20. That means investors are paying 20 times earnings for the stock. EPS is also useful for tracking profitability trends. If EPS grows steadily over several years, it may suggest the company is improving margins, increasing sales, managing costs well, or using buybacks effectively. However, EPS should always be compared with revenue growth, cash flow, debt levels, and industry peers. A high EPS doesn't automatically mean a stock is a good investment. A low EPS doesn't automatically mean a company is weak. Context matters.
The Illusion of Growth: How Buybacks Manipulate EPS

Share buybacks can make EPS look better without real profit growth. When a company repurchases its own shares, the total number of shares outstanding falls. Since EPS divides profit by shares, fewer shares can lift EPS even if net income stays the same.
For example, if a company earns $10 million and has 10 million shares, EPS is $1. If it buys back 10% of its shares and net income stays at $10 million, the new share count is 9 million. EPS rises to $1.11. That looks like growth, but the company didn't earn more money. The per share number improved because the denominator got smaller.
Buybacks aren't always bad. They can be valuable when a company has excess cash and its stock is reasonably priced. But investors should be careful. If EPS growth comes mainly from buybacks while revenue and net income are flat, the business may not be improving as much as the headline number suggests.
Conclusion

EPS is one of the most important numbers in an earnings report, but it shouldn't be read in isolation. Start with basic EPS, then check diluted EPS. Look at net income, preferred dividends, and weighted average shares to understand the calculation behind the result.
The next time you review a company’s quarterly or annual report, find the basic and diluted EPS lines yourself. Then ask what changed. Did profit rise? Did the share count fall? Did dilution increase? The best investors don't just read EPS. They understand what created it.