
If you’re starting to analyze stocks, EPS meaning is one of the first concepts you need to understand. EPS, or earnings per share, shows how much profit a company earns for each common share outstanding. In simple terms, it helps investors see whether a company is turning business performance into shareholder value. While EPS isn’t the only number you should use, it’s a core building block for stock analysis, valuation, and long term investing decisions.
What is Earnings Per Share EPS? The Foundation of Profitability

What is EPS? EPS is the portion of a company’s profit assigned to each share of common stock. A simple EPS definition is this: earnings per share measures how much net profit belongs to each common share after preferred dividends are removed.
For example, if a company earns strong profits but has many shares outstanding, each share may receive a smaller slice of those earnings. If another company earns less total profit but has fewer shares, its EPS may still look attractive. That’s why EPS helps investors look beyond headline profit and understand profit on a per share basis. EPS matters because shareholders don’t own the whole company directly. They own individual shares. Earnings per share translates company wide profit into a number that connects more directly to what each share represents.
The EPS Formula: How to Calculate It Step-by-Step
The standard EPS formula is:
This earnings per share formula focuses on common shareholders. Preferred dividends are subtracted because preferred shareholders have a higher claim on certain payouts. After those dividends are removed, the remaining profit belongs to common shareholders.
Here’s how to calculate earnings per share step by step.
- First, find net income. This is the company’s profit after expenses, taxes, and interest.
- Second, subtract preferred dividends if the company has preferred shares.
- Third, find the weighted average number of common shares outstanding during the period.
- Fourth, divide the adjusted profit by the weighted average common shares.
For example, imagine a company reports $10 million in net income. It pays $1 million in preferred dividends and has 3 million weighted average common shares outstanding. The EPS would be $3. That means each common share represents $3 of company earnings for that period. A higher EPS can be a positive sign, but only when it comes from real business improvement, not just financial engineering.
Interactive Tool: Earnings Per Share Calculator
Interactive EPS Calculator
Enter net income, preferred dividends, and weighted average common shares outstanding. The calculator will automatically calculate earnings per share and show what drives the result.
EPS = (Net Income − Preferred Dividends) ÷ Weighted Average Common Shares Outstanding
An earnings per share calculator should let users enter three numbers: net income, preferred dividends, and weighted average shares outstanding. Once those values are entered, the calculator can instantly show EPS.
The tool should work like this:
- Enter net income.
- Enter preferred dividends.
- Enter weighted average common shares outstanding.
- Calculate earnings per share.
This is useful because EPS becomes clearer when investors test real numbers. For example, if net income rises while share count stays flat, EPS increases. If net income stays the same but the company issues more shares, EPS declines. If the company buys back shares, EPS may increase even when profit doesn’t grow. That’s why an EPS calculator shouldn’t only give an answer. It should help users understand what changed behind the number.
Basic vs. Diluted EPS: What Every Investor Needs to Know
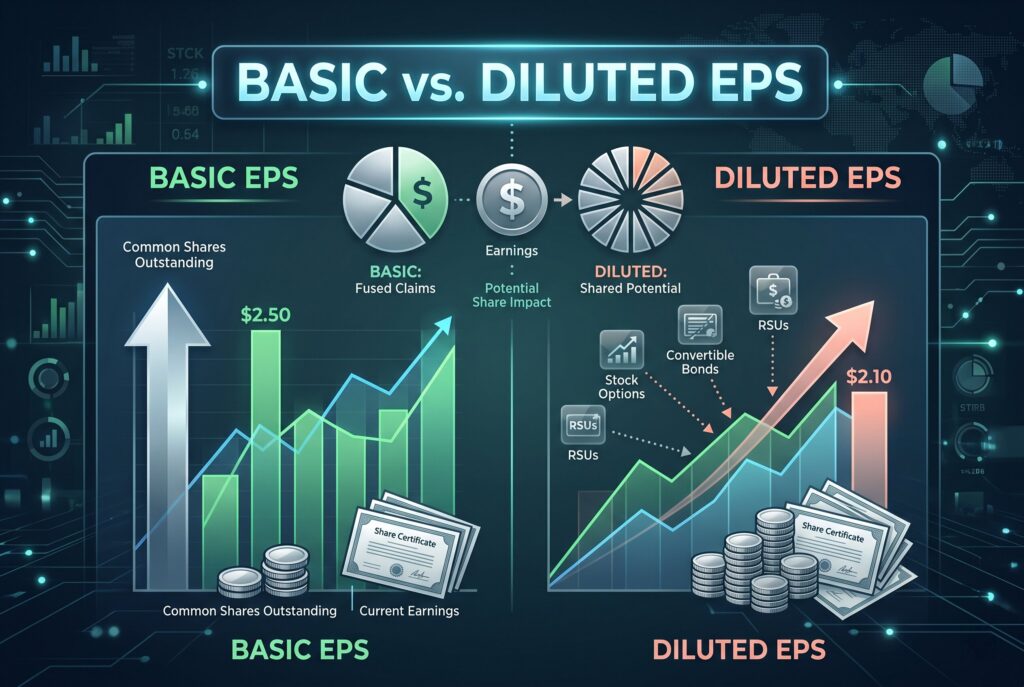
Basic EPS uses the current weighted average number of common shares outstanding. Diluted EPS goes one step further. It includes the potential impact of shares that could be created from stock options, restricted stock units, warrants, convertible bonds, or convertible preferred shares.
Diluted EPS is especially important when analyzing technology companies, growth companies, or businesses that use stock based compensation heavily. If many employee stock options or convertible securities exist, future share count may increase. That means each existing share could represent a smaller claim on future earnings. This is called dilution.
Basic vs diluted EPS matters because basic EPS may look stronger than the economic reality. Diluted EPS gives a more conservative view by asking: what happens if potential shares become real shares? In most cases, diluted EPS is lower than basic EPS. If diluted EPS is much lower, investors should pay attention. It may signal that future ownership could be spread across more shares, reducing the profit attributed to each current share.
Why EPS Matters: Valuation and the P/E Ratio Connection
EPS matters because it connects directly to valuation. One of the most common valuation metrics, the price to earnings ratio, or P/E ratio, uses EPS in its calculation.
If a stock trades at $60 and the company earns $3 per share, the P/E ratio is 20. This means investors are paying 20 times the company’s earnings per share. EPS also helps investors track profitability trends. A single EPS number can be useful, but EPS growth over several years is more powerful. If EPS grows steadily, it may show that the company is improving profits, managing costs, increasing revenue, or reducing share count.

However, investors should compare EPS growth with revenue growth. If EPS rises while revenue is flat, the improvement may come from buybacks or cost cuts rather than stronger demand. That isn’t always bad, but it needs context. EPS is also useful for comparing companies in the same industry. It shouldn’t be used blindly across unrelated sectors because banks, retailers, software companies, and manufacturers all have different business models and capital needs.
The Limitations of EPS: Can Companies Manipulate the Numbers?

EPS is powerful, but it isn’t perfect. Companies can influence EPS in ways that don’t always reflect better business performance. One common example is share buybacks. When a company buys back its own shares, the number of shares outstanding falls. If net income stays the same, EPS rises automatically because profit is divided among fewer shares. This can make earnings per share look better even when the company hasn’t increased total profit.
That’s why understanding EPS meaning goes beyond just looking at the number. Investors need to examine what’s driving the change, whether it’s real business growth, cost improvements, or simply financial engineering like buybacks.
EPS can also be affected by accounting decisions, one time gains, restructuring charges, tax changes, or asset sales. That’s why investors often look at adjusted EPS, but adjusted EPS also needs caution. Sometimes adjustments remove real costs that shareholders shouldn’t ignore.
EPS also doesn’t show cash flow. A company can report positive earnings but still struggle with weak cash generation. For this reason, EPS meaning should always be reviewed alongside free cash flow, revenue growth, debt levels, margins, and return on equity. Another limitation is that EPS can be negative. For early stage companies or cyclical businesses, negative EPS may occur during heavy investment periods or economic downturns. That doesn’t automatically mean the company is worthless, but it does make valuation more complex and requires a deeper look into the business fundamentals.
Conclusion
EPS is one of the most important numbers in stock analysis because it shows how much profit belongs to each common share. It helps investors understand profitability, compare companies, calculate the P/E ratio, and track long term business progress.
Still, EPS meaning shouldn’t be used alone. Look at basic EPS, diluted EPS, EPS growth, cash flow, revenue trends, and industry context before making an investment decision. These days, smart investors won’t just ask whether EPS is high. They’ll ask why it’s high, whether it’s sustainable, and whether it reflects real business strength.