
Descriptive analysis is the first step to understanding what your portfolio is really doing. Before you forecast returns, rebalance assets, or compare strategies, you need to organize the historical data you already have. Investors have access to more dashboards than ever, but raw numbers alone don’t create insight. Descriptive analysis turns performance data into a clear picture of return, risk, volatility, and portfolio health.
What Is Descriptive Analysis in Portfolio Management?
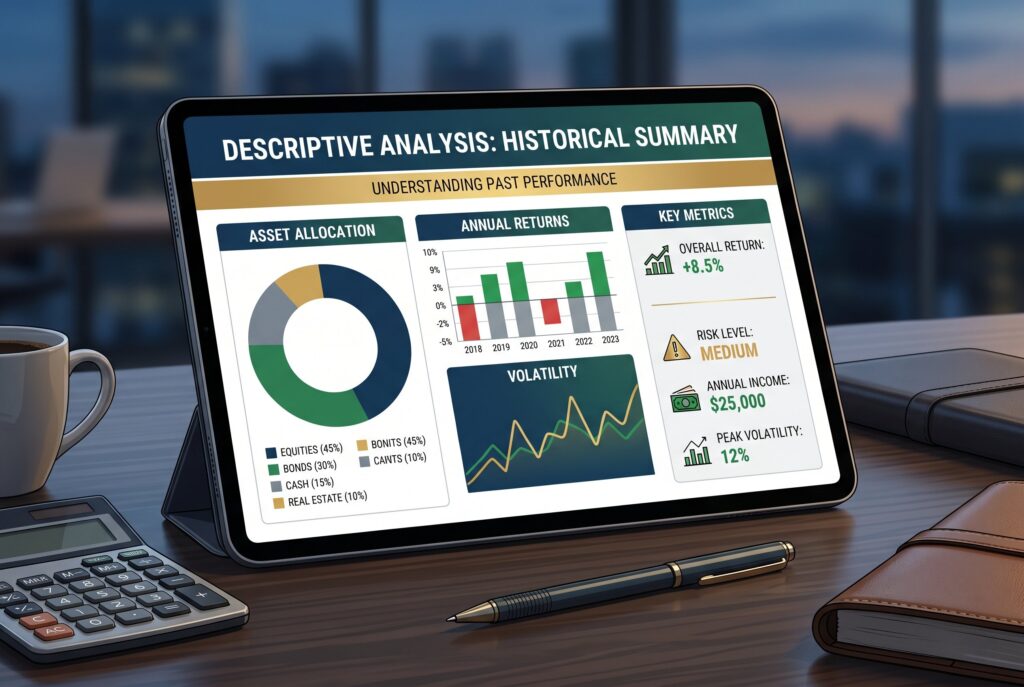
Descriptive analysis is the process of summarizing historical data so you can understand what happened, when it happened, and how important it was. In portfolio management, it helps investors evaluate past returns, risk levels, asset allocation, income, and volatility without making complex predictions.
This connects closely to descriptive statistics. So, what is descriptive statistics? Descriptive statistics is a set of methods used to organize, summarize, and present the main features of a dataset. A simple descriptive statistics definition is this: it explains the data you already have instead of predicting data you don’t have. For investors, that means looking at portfolio returns, dividend income, drawdowns, standard deviation, and asset weights to understand the current condition of a portfolio.
4 Steps to Use Descriptive Analysis for Portfolio Valuation

Step 1: Collect and Standardize Your Data
Gather transactions, deposits, withdrawals, dividends, interest income, asset prices, and fees. Ensure all data covers the same time period and uses consistent currency, date formats, and asset categories.
Step 2: Calculate Key Portfolio Performance Statistics
Include average return, median return, highest return, lowest return, total return, and average portfolio value. This provides a clear snapshot of overall performance.
Step 3: Analyze Portfolio Volatility and Risk
Use standard deviation, range, and drawdown to evaluate how volatile the portfolio is. High returns can still come with significant risk if performance fluctuates widely.
Step 4: Benchmark Portfolio Performance Against Market Indexes
Compare your portfolio with relevant benchmarks such as stock indexes, bond indexes, or blended benchmarks to determine whether you are truly outperforming the market.
Summary Statistics: The Heartbeat of an Investment
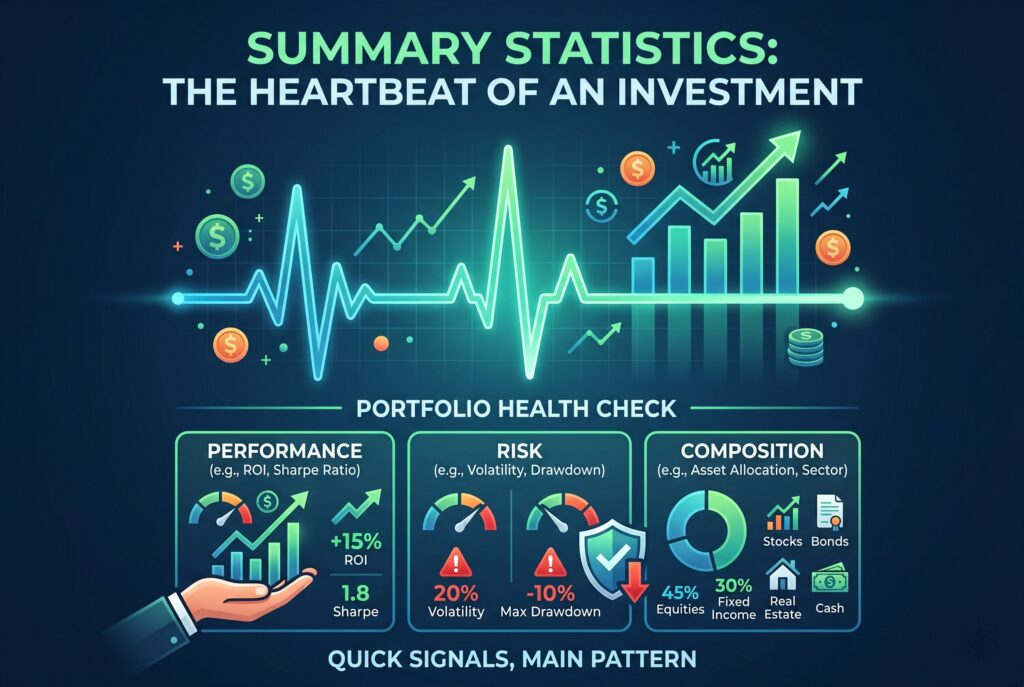
Summary statistics are the quick signals that show whether your portfolio is healthy. They don’t tell the whole story, but they help you understand the main pattern fast. The mean return shows the average performance across a period. The median return shows the middle result, which can be useful when one unusually strong or weak period distorts the average.
Standard deviation shows how much returns move around the average. A low standard deviation usually means steadier performance. A high standard deviation means more volatility. The maximum and minimum returns show the best and worst results in your dataset. These numbers help investors understand the possible range of outcomes.
For example, a portfolio with an average quarterly return of 3% may look strong. But if the best quarter was 18% and the worst quarter was negative 14%, the investor needs to understand that the return path is unstable.
Portfolio Performance Analyzer

A portfolio performance analyzer should help users upload or enter portfolio data and instantly see descriptive statistics. The tool should calculate total return, average return, median return, standard deviation, best period, worst period, and benchmark difference. It should also display simple charts, such as a portfolio value line chart, return distribution chart, and asset allocation chart.
This matters because investors often misunderstand performance when they only look at the ending balance. A portfolio may finish the year higher but still carry hidden concentration risk, high volatility, or weak risk adjusted returns. A good tool makes the invisible visible. It shows whether growth came from broad portfolio strength or from one asset carrying the entire result.
Descriptive vs Inferential Statistics: Which One Do You Need?

Descriptive vs inferential statistics is an important distinction for investors. Descriptive statistics explains what already happened. It tells you your average return, your worst month, your current asset allocation, or your dividend income over the past year.
Inferential statistics uses a sample of data to make estimates or predictions about a larger population or future result. For example, an investor might use historical market data to estimate the probability that a portfolio will achieve a target return over the next decade. For portfolio valuation today, descriptive statistics comes first. You need to understand your current and historical data before making forecasts.
Inferential tools can be useful later, but they shouldn’t replace basic descriptive analysis. If your portfolio data is messy, incomplete, or misunderstood, any prediction built on it may be unreliable.
Descriptive Statistics Examples: Analyzing a 60/40 Portfolio
Let’s use one of the most common descriptive statistics examples: a 60/40 portfolio. This portfolio holds 60% stocks and 40% bonds. Imagine the portfolio earned quarterly returns of 4%, 2%, negative 3%, and 5%. The average quarterly return is 2%. That looks positive.
But descriptive analysis goes deeper. The negative third quarter tells you the portfolio still experienced downside risk. If the stock portion fell sharply while bonds only partly protected the portfolio, the investor may need to review whether the 60/40 allocation still matches their risk tolerance.
Now add summary statistics. The highest quarterly return was 5%. The lowest was negative 3%. The range was 8% points. If standard deviation is moderate, the portfolio may be behaving as expected. If standard deviation is rising, volatility may be increasing and rebalancing may be needed.
This is where descriptive analysis becomes practical. It doesn’t just show returns. It helps investors decide whether their allocation remains balanced, whether risk is drifting, and whether the portfolio still supports the original goal.
Conclusion
Descriptive analysis isn’t just a technical exercise. It’s the map that helps investors understand the structure of their returns. Without it, portfolio decisions can become emotional, reactive, or based on incomplete information.
Start with summary statistics. Review average return, median return, standard deviation, range, drawdown, and benchmark performance. Then look at the story behind those numbers. Smart portfolio management begins with a simple rule: understand what happened before deciding what to do next.