
Statistics can feel dry until you realize it’s just a way to turn messy data into something useful. Descriptive statistics is the first step in that process. It helps you summarize a dataset, spot patterns, and understand what the numbers are saying before you try to predict anything. In finance, business, research, and everyday analysis, descriptive analysis helps people move from raw data to clearer decisions.
What is Descriptive Statistics?
Descriptive statistics are brief informational measures that summarize a dataset. The dataset may represent an entire population or a sample of a larger population. A simple descriptive statistics definition is this: descriptive statistics organizes, summarizes, and explains the main features of data you already have. It doesn’t predict the future. It doesn’t prove what will happen next. It only describes what the data shows right now.
So, what is descriptive statistics in practical terms? It’s the process of answering basic but important questions like: What is the average? How spread out are the values? Which value appears most often? Are the results clustered together or scattered widely?
The 3 Pillars of Descriptive Analysis

Descriptive analysis usually has three main pillars: central tendency, variability, and frequency distribution.
Central Tendency
The first pillar is central tendency. This tells you where the “center” of the data sits. The mean is the average, calculated by adding all values and dividing by the number of values. The median is the middle value when the data is arranged from smallest to largest. The mode is the value that appears most often.
Variability
The second pillar is variability, also called dispersion. This explains how spread out the data is. The range shows the difference between the highest and lowest values. Variance measures how far values are from the mean. Standard deviation shows the typical distance between each value and the average.
Frequency Distribution
The third pillar is frequency distribution. This shows how often certain values or groups of values appear. For example, a company may look at how many customers spend $0 to $50, $51 to $100, or more than $100 per order. That makes patterns easier to see.
Summary Statistics: Quick Techniques for Financial Data
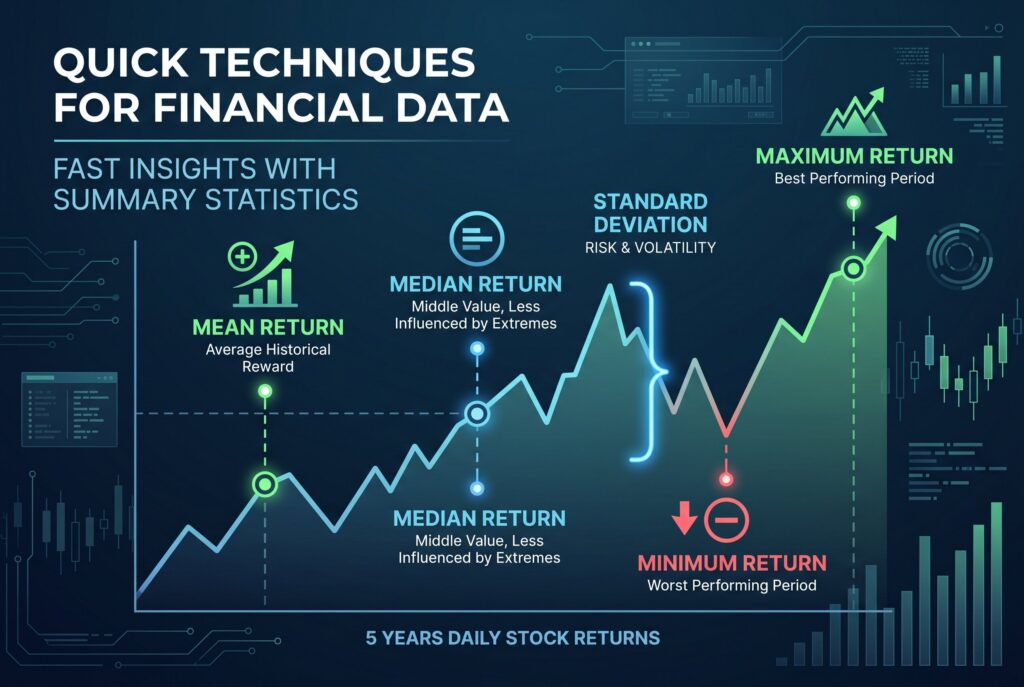
Summary statistics are the quick numerical snapshot analysts use to understand a dataset fast. In finance, this is especially useful because investors often deal with thousands of data points, such as daily stock prices, monthly returns, or portfolio performance.
Imagine you’re analyzing five years of daily returns for a stock. You don’t want to read every single daily movement manually. Instead, you can calculate summary statistics such as mean return, median return, standard deviation, minimum return, and maximum return.
The mean return tells you the stock’s average historical reward. The standard deviation tells you how risky or volatile that return has been. The minimum and maximum values show the worst and best periods in the dataset. This is why summary statistics are so valuable. They compress a large amount of information into a few numbers that are easier to interpret.
Interactive Tool: Descriptive Data Visualizer
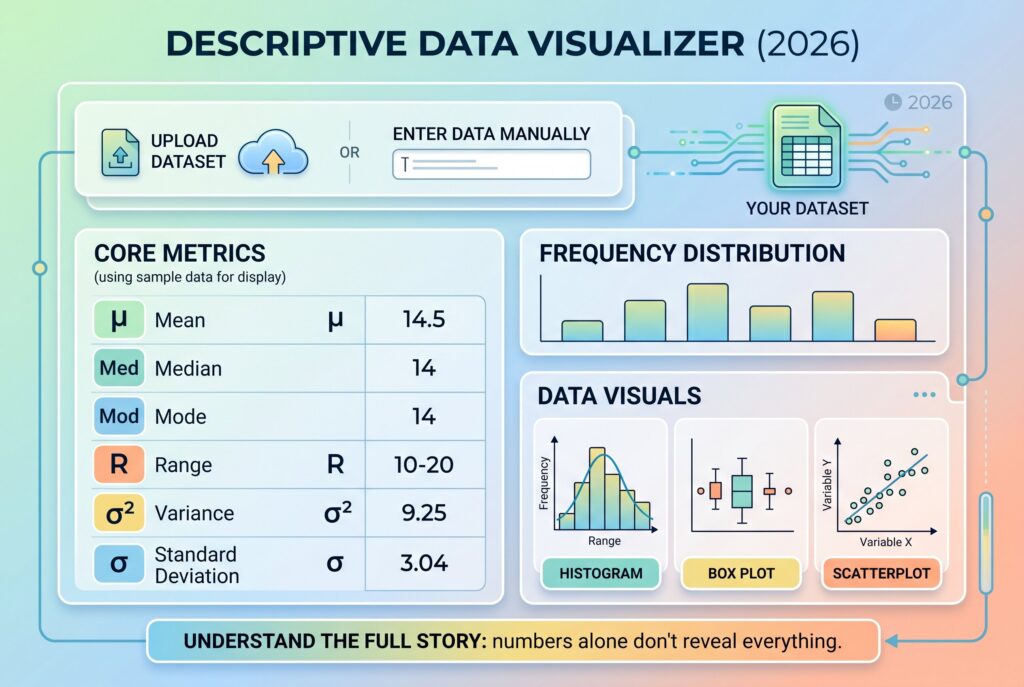
A descriptive data visualizer should let users enter or upload a dataset and instantly see the core metrics. It should show the mean, median, mode, range, variance, standard deviation, and frequency distribution. The tool should also create simple charts such as a histogram, box plot, or scatterplot. These visuals matter because numbers alone don’t always reveal the full story.
For example, two datasets may have the same mean but completely different risk patterns. One may be stable and predictable, while the other may swing wildly. A visualizer makes those differences obvious.
Descriptive Statistics Examples: Analyzing Stock Market Returns
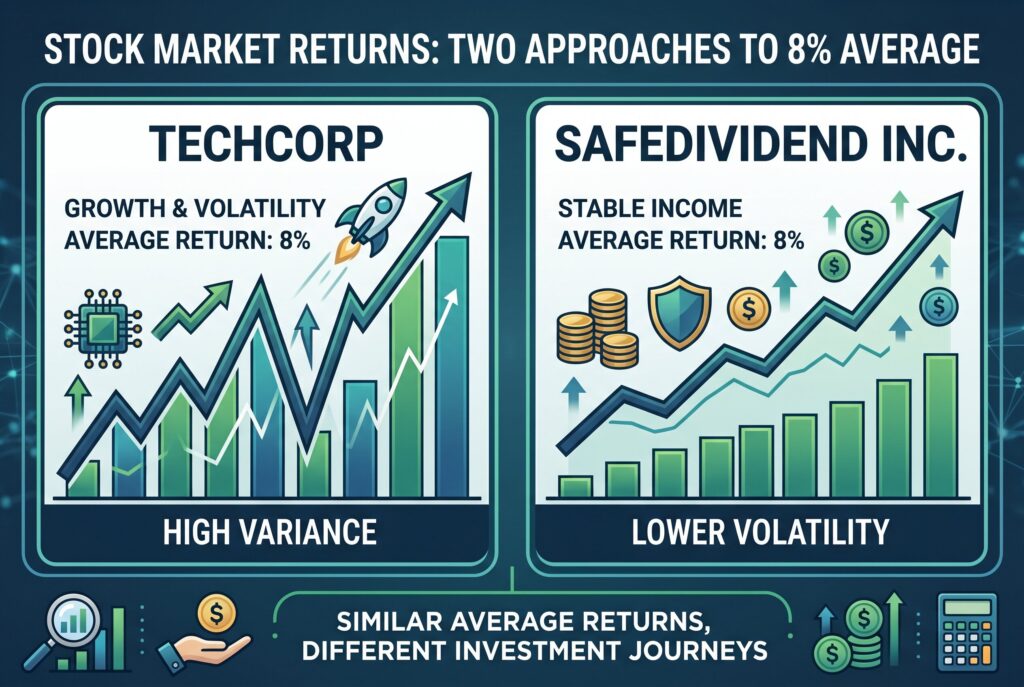
Let’s look at a simple finance example. Suppose two fictional stocks, TechCorp and SafeDividend Inc., both have an average annual return of 8%. If you only look at the mean, they seem equally attractive. But that one number hides the real difference.
TechCorp has annual returns of 25%, negative 12%, 30%, negative 8%, and 5%. Its average return is still around 8%, but the results are unstable. The high standard deviation shows that returns move dramatically from year to year.
SafeDividend Inc. has annual returns of 7%, 9%, 8%, 8%, and 8%. Its average return is also 8%, but the returns are much more consistent. The standard deviation is low, which means the stock has shown less variability.
The takeaway is simple: using only one descriptive statistic can be dangerous. The mean tells you the average return, but standard deviation tells you how risky that return has been. A full descriptive analysis gives a clearer picture.
Descriptive vs Inferential Statistics: What is the Difference?
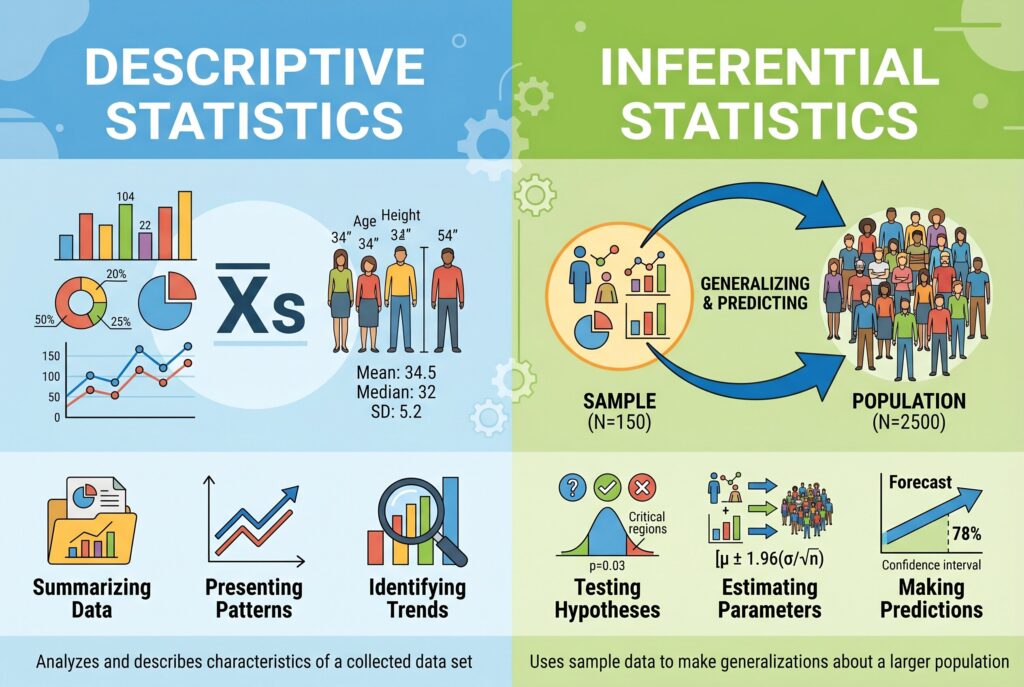
Descriptive vs inferential statistics is one of the most important distinctions in data analysis. Descriptive statistics describes the data you already have. For example, “The average return of this stock over the past five years was 8%.” That statement summarizes historical data.
Inferential statistics uses a sample to make predictions, estimates, or conclusions about a larger population or future outcome. For example, “Based on the past 50 years of market data, there is a 95% probability the market will be positive over the next decade.”
Inferential vs descriptive statistics comes down to purpose. Descriptive statistics looks backward or at the present dataset. Inferential statistics tries to generalize beyond the dataset.
Descriptive statistics answers: What happened in this data? Inferential statistics answers: What might this data suggest about something bigger? Both are useful, but they shouldn’t be confused. You usually start with descriptive statistics because you need to understand the data before making predictions from it.
Conclusion
Descriptive statistics doesn’t predict the future, but it gives you the foundation for smarter analysis. It turns raw numbers into a clear story by showing averages, variation, frequency, and patterns. Whether you’re analyzing stock returns, customer spending, survey results, or business performance, descriptive statistics helps you understand what the data is saying before you act. It’s the mandatory first step in turning chaotic information into decisions you can trust.