

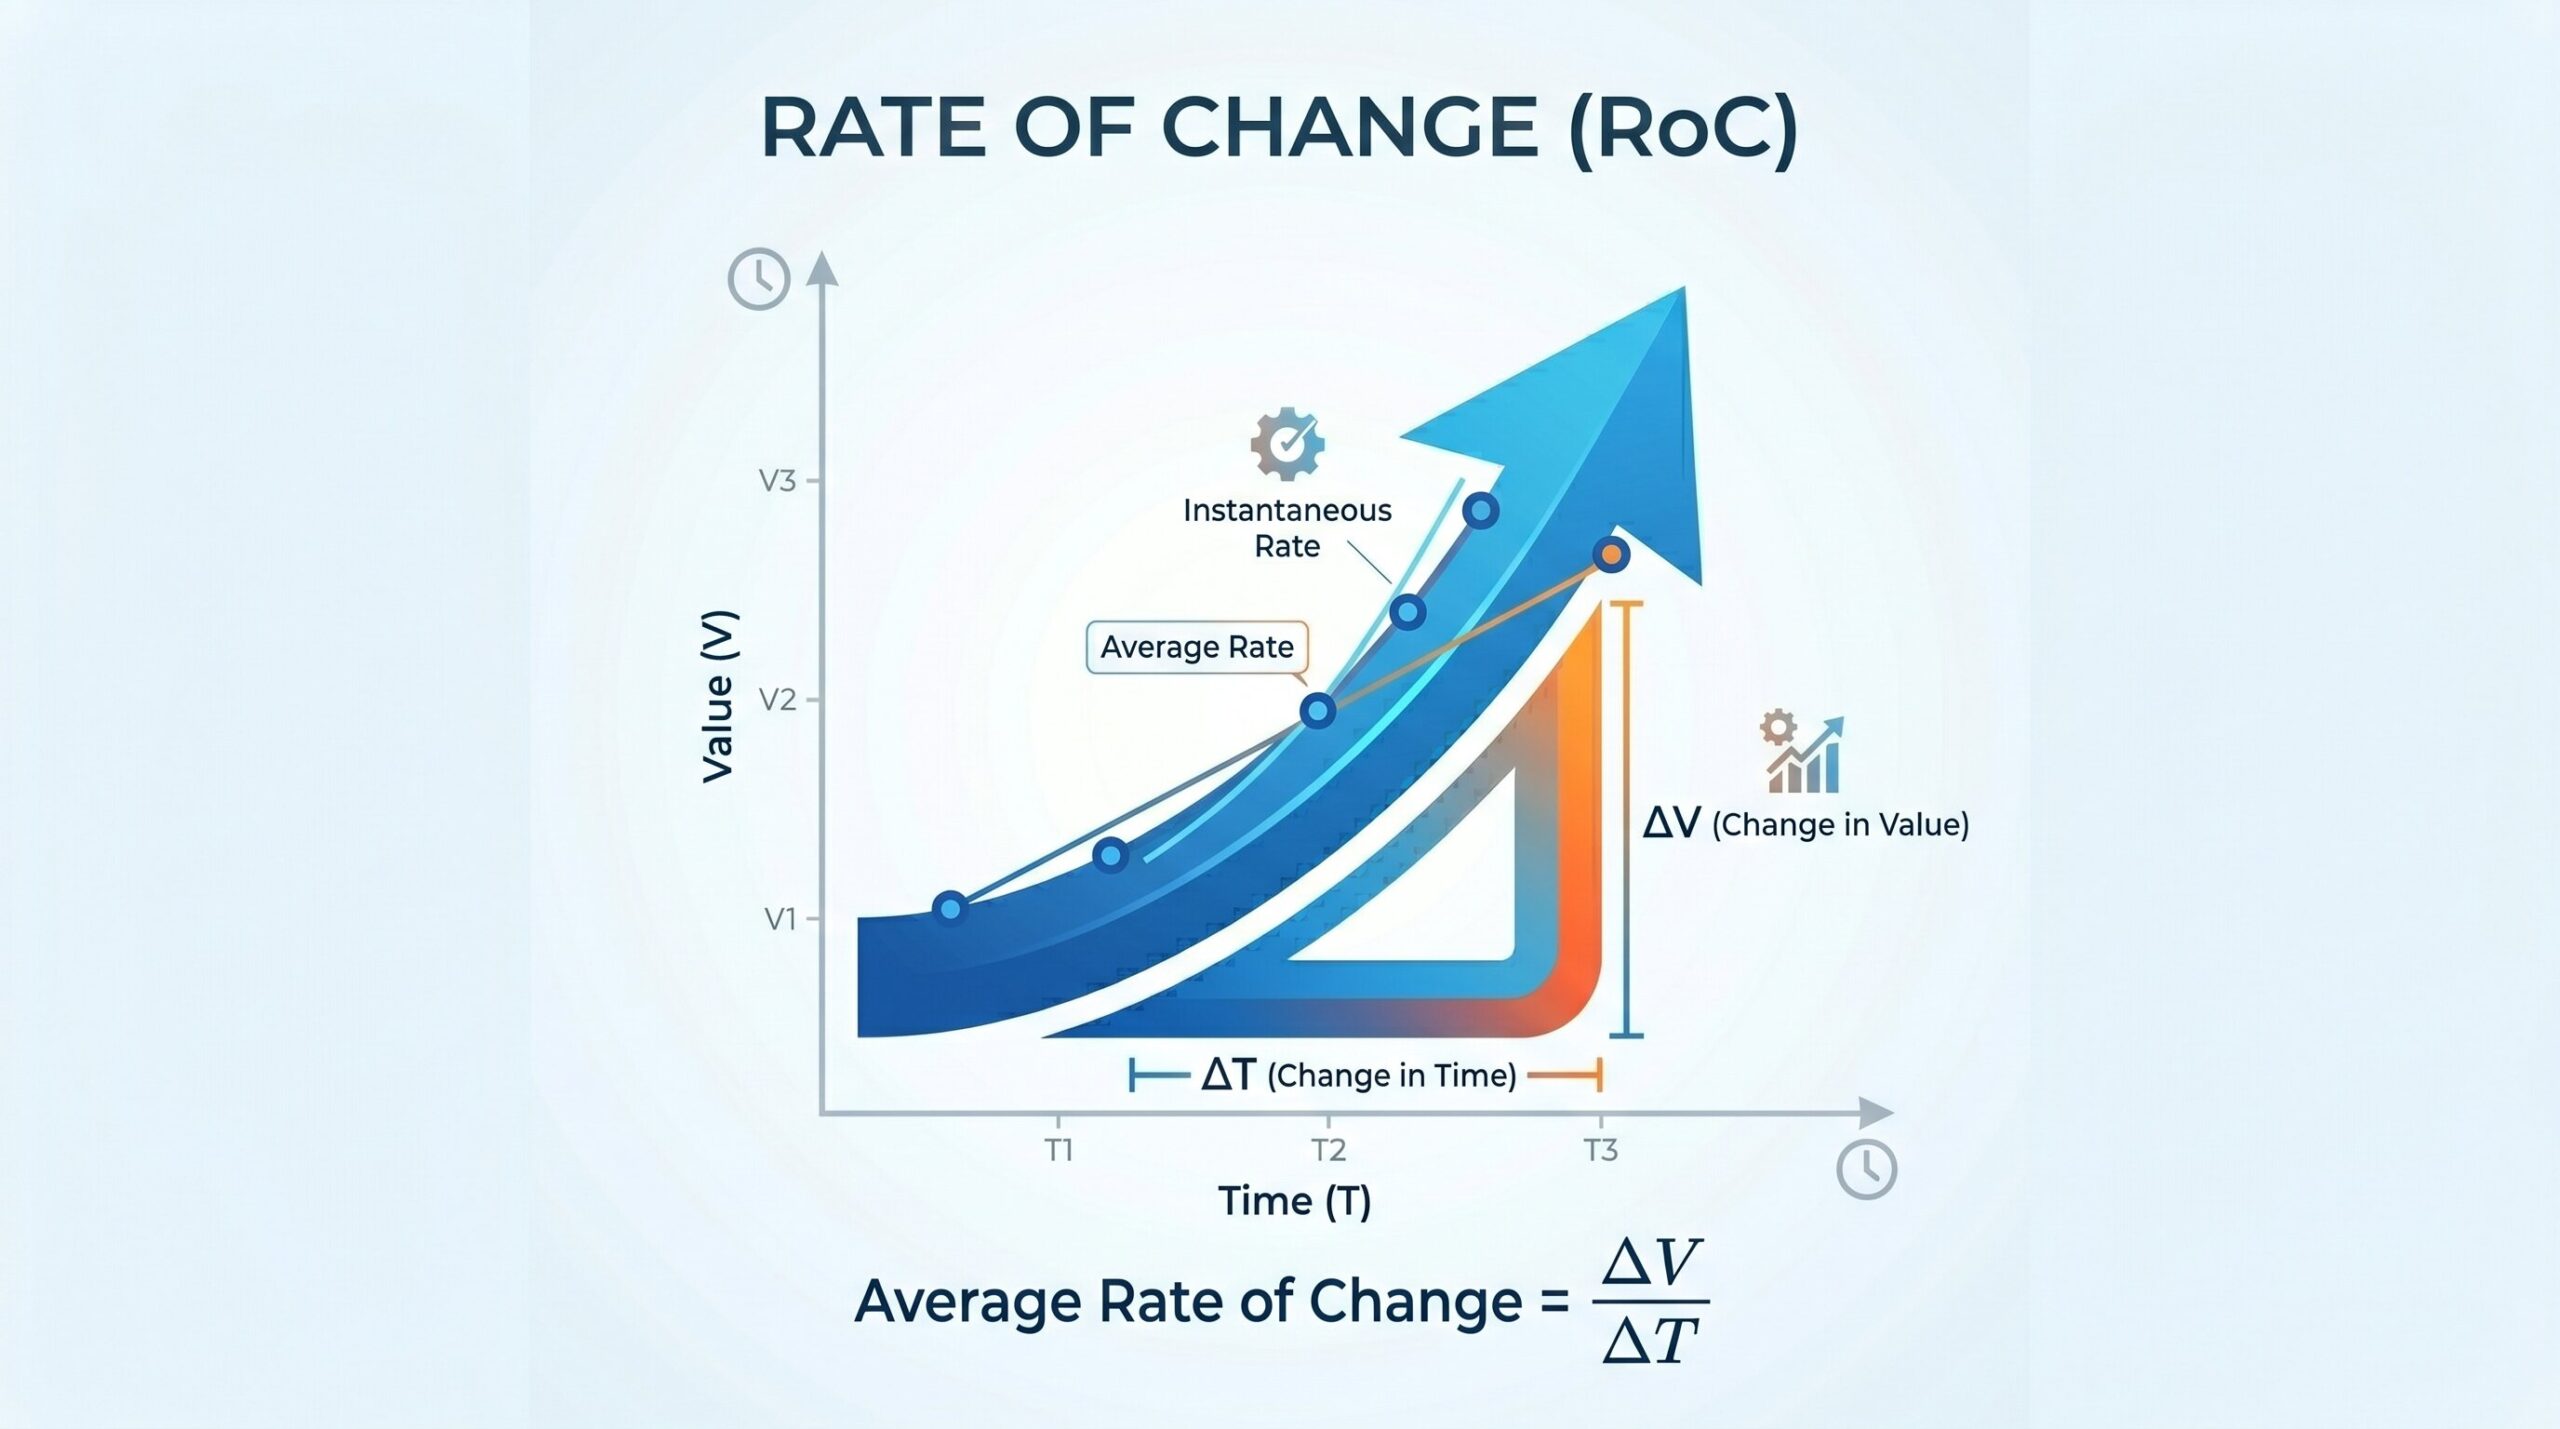
What is the rate of change? In simple terms, rate of change measures how quickly one value changes compared with another. In algebra, it is often used to describe the slope of a line. If you’re wondering how to find rate of change, it typically involves comparing the difference between two values over a given interval. In finance, rate of change becomes a momentum tool that helps traders see how fast an asset price is rising or falling. Understanding the rate of change formula matters whether you’re solving a graph problem, reviewing stock performance, or studying price movement.
In finance, this is similar to looking at how much a stock changed over a 10-day, 20-day, or 30-day period. If you’re asking how to find average rate of change, choose two points, subtract the starting value from the ending value, then divide by the change in time.
From Math Class To The Stock Market

The rate of change definition starts with a basic idea: compare the change in one variable to the change in another. In math class, that often means measuring how much y changes when x changes. If the change is consistent, you have a constant rate of change.
In financial markets, the x-axis is usually time, and the y-axis is usually price. That means traders use rate of change to measure how quickly a stock, index, currency, or crypto asset moves over a chosen period. This financial version is often called the Price Rate of Change, or ROC indicator. If you’re wondering how to find the rate of change in finance, you compare today’s price with a past price and express the difference as a percentage.
The Financial Rate Of Change Formula: How To Calculate It
The financial rate of change formula is:
This formula shows the percentage change between two prices. It’s one of the easiest ways to measure price momentum.
For example, imagine a stock moves from $100 to $150 over 10 days. The calculation is:
That means the stock has a 50% rate of change over that period. If the stock moved from $150 down to $100, the ROC would be negative. This is how to calculate the rate of change when you want to understand the size and direction of a price move. A rate of change calculator can do this instantly, but the formula is simple enough to check by hand. The key is choosing the correct previous price and time period.
Interpreting ROC: What The Numbers Tell Traders
A positive rate of change means the asset price has risen compared with the previous price. This can signal upward momentum. Traders may read this as a sign that buyers are in control.
A negative rate of change means the asset price has fallen over the chosen period. This can signal downward momentum. Traders may use this as a warning that selling pressure is increasing. A zero ROC means there has been no net price change between the two points. This may suggest a sideways market or a pause before a stronger move.
However, ROC shouldn’t be used alone. A fast positive move may indicate strong momentum, but it may also suggest an overbought condition. A deep negative move may indicate weakness, but it may also suggest an oversold setup. That’s why traders often combine ROC with trend lines, volume, moving averages, or support and resistance levels.
Average Vs. Instantaneous Rate Of Change
Average rate of change measures the overall change between two points. The average rate of change formula is:
In finance, this is similar to looking at how much a stock changed over a 10-day, 20-day, or 30-day period. If you’re asking how to find the average rate of change, choose two points, subtract the starting value from the ending value, then divide by the change in time. The AROC formula is especially useful when you care about the general movement across an interval instead of every small fluctuation inside it.
Instantaneous rate of change is different. It measures change at one exact moment. In calculus, the instantaneous rate of change formula is connected to the derivative. Instead of measuring between two points, it measures the slope at a single point on a curve. For most traders, ROC is closer to the average rate of change because it compares a current price with a past price over a set lookback period.
Constant Rate Of Change In Simple Terms
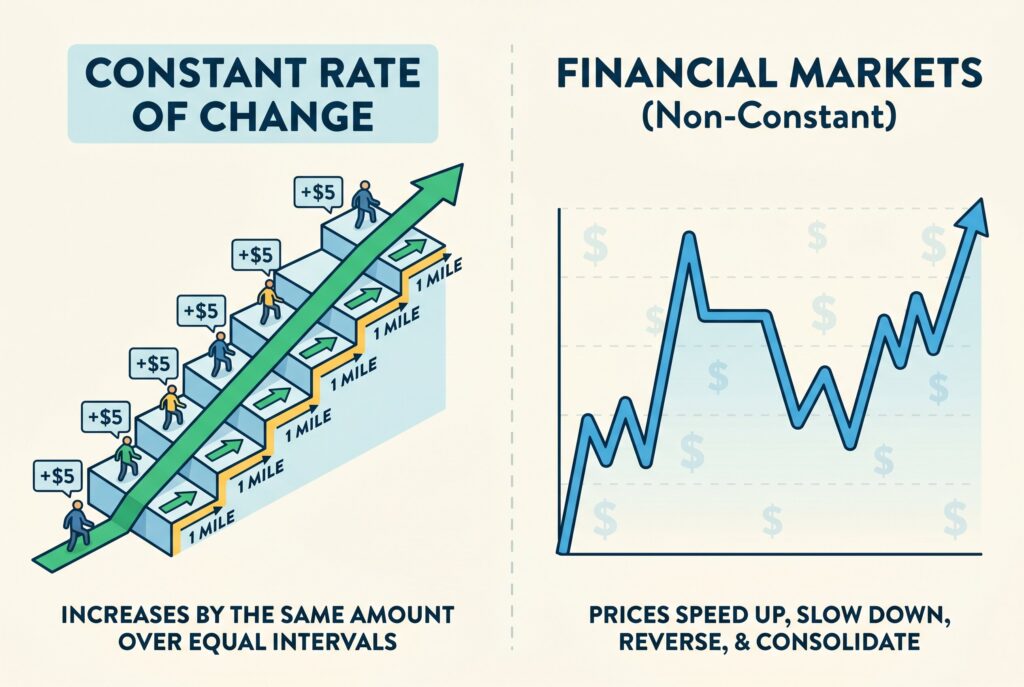
A constant rate of change happens when a value changes by the same amount over equal intervals. On a graph, this creates a straight line. For example, if a delivery fee increases by $5 every mile, the rate of change is constant.
Financial markets rarely move with a constant rate of change. Prices speed up, slow down, reverse, and consolidate. That is why the ROC indicator is useful: it helps reveal whether momentum is increasing or weakening over time. Still, understanding the constant rate of change is helpful because it builds the foundation for interpreting more complex price behavior.
Rate Of Change Calculator: When To Use One
A rate of change calculator is useful when you need quick results or want to compare multiple assets. You can enter the current price and previous price, then calculate the percentage change instantly. An average rate of change calculator is helpful for students working with functions, graphs, or tables. It can also help business users compare revenue, expenses, customer growth, or traffic changes across periods. The calculator saves time, but it shouldn’t replace understanding. If you know the formula, you’ll understand what the number actually means and whether the result is meaningful.
Conclusion
Rate of change is simple at its core, but powerful in practice. In math, it helps explain slope, average change, and constant rate of change. In finance, the ROC indicator helps traders measure momentum and understand how quickly prices are moving.
Whether you’re studying the average rate of change formula or using ROC to evaluate a stock or forex trade, the goal is the same: compare where a value started with where it is now. Once you master the rate of change formula, you can read movement with more confidence and make better decisions from the numbers.
