


Contribution margin ratio is one of the clearest ways to see how efficiently your business turns sales into profit potential. Also called the CM ratio, it shows the percentage of revenue left after variable costs are paid. These days, when costs can shift quickly, this metric helps business owners, finance students, and managers understand whether a product can cover fixed costs and support long-term profitability.
Interactive Tool: CM Ratio And Break-Even Calculator
A CM ratio and break-even calculator helps you turn accounting data into real decisions. Instead of only reading the formula, you can enter sales revenue, variable costs, and fixed costs to estimate contribution margin, CM ratio, and break-even sales.
This is especially useful when launching a product, planning a promotion, or reviewing a low-margin service. If your calculator shows that fixed costs are too high for your current CM ratio, you may need to raise prices, reduce variable costs, or increase sales volume before the business becomes profitable.
2026 CM Ratio and Break-Even Calculator
Use this interactive calculator to turn accounting data into practical business decisions. Enter sales revenue, variable costs, and fixed costs to estimate contribution margin, contribution margin ratio, break-even sales, and current profit or loss.
Contribution Margin = Sales Revenue − Variable Costs
CM Ratio = Contribution Margin ÷ Sales Revenue × 100
Break-Even Sales = Fixed Costs ÷ CM Ratio
Current Profit or Loss = Contribution Margin − Fixed Costs
Margin of Safety = Sales Revenue − Break-Even Sales
Note: This calculator uses a simple contribution margin model. It assumes costs are properly separated into fixed and variable categories.
The Contribution Margin Ratio Formula Explained
The contribution margin formula starts with revenue minus variable costs. Variable costs are costs that rise or fall with sales volume. They may include raw materials, packaging, payment processing, shipping, sales commissions, direct labor, or server usage. For example, imagine you sell a software subscription for $100. Your variable costs, including server cost and payment fees, total $30. Your contribution margin is $70.
Now divide that $70 contribution margin by the $100 sales price. The result is 0.70, or 70%. This means that for every additional dollar of revenue, 70 cents remains to cover fixed costs and profit after the business breaks even. This is how to calculate contribution margin in percentage form. The higher the ratio, the more revenue is available to absorb fixed costs and create operating profit.
CM Ratio Vs. Contribution Margin Per Unit
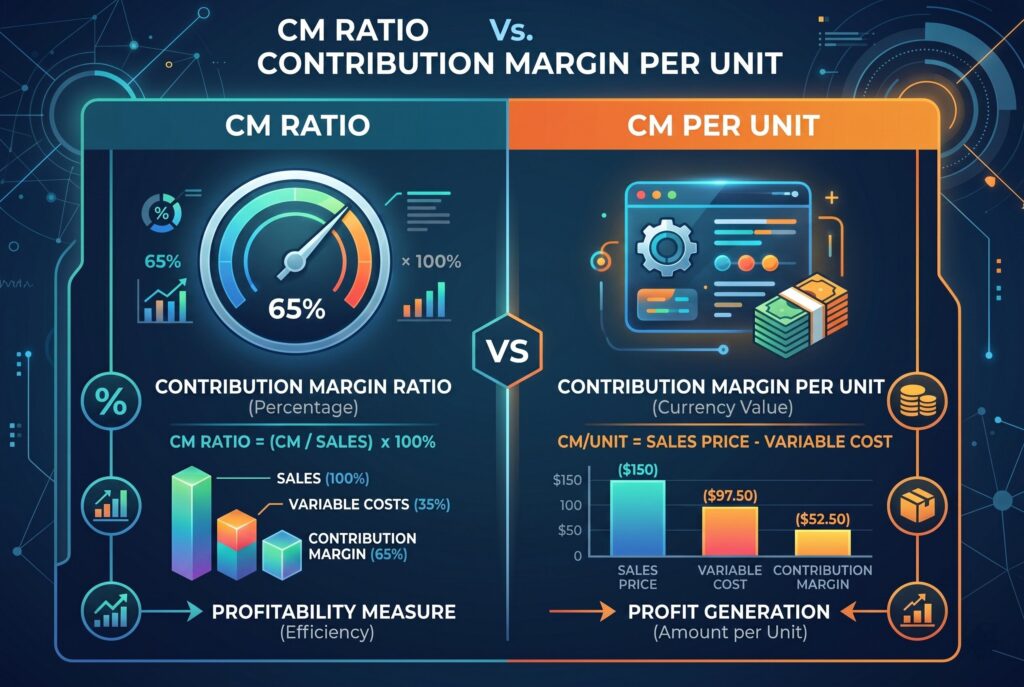
Contribution margin per unit and contribution margin ratio are related, but they answer different questions. Contribution margin per unit shows the dollar amount left from each sale. If a product sells for $100 and variable costs are $30, the contribution margin per unit is $70. This number is best for calculating break-even units and understanding how much each product contributes.
The contribution margin ratio expresses that same relationship as a percentage. In the same example, the ratio is 70%. This is best for comparing profitability across products with different prices. For example, a $500 product with a $100 contribution margin has a 20% CM ratio. A $100 product with a $50 contribution margin has a 50% ratio. The first product contributes more dollars per unit, but the second product is more efficient as a percentage of revenue.
What Is A Good CM Ratio? Industry Benchmarks
A good contribution margin ratio depends on your industry, cost structure, and business model. There isn't one universal number. A company with low variable costs can operate with a much higher ratio than a business that relies on materials, shipping, or direct labor.
Software And SaaS

Software and SaaS businesses often have very high contribution margin ratios, commonly around 70% to 90%. Once the product is built, the cost of serving one more user can be relatively low. Variable costs may include hosting, customer support, payment processing, and sales commissions. A high CM ratio in SaaS gives the company more room to cover fixed costs like engineering, marketing, and admin salaries. However, customer acquisition cost still matters, even if it isn't always treated as a direct variable cost.
Retail And E-Commerce

Retail and e-commerce businesses often land in the middle range, commonly around 30% to 50%. Their ratios are affected by inventory cost, packaging, shipping, returns, fulfillment fees, and payment processing. For this reason, a product that looks profitable based on selling price may have a weaker contribution margin ratio once all variable costs are included. E-commerce brands should calculate the ratio by SKU, sales channel, and promotion type.
Manufacturing

Manufacturing businesses often have lower contribution margin ratios, commonly around 20% to 40%, because materials, machine time, direct labor, scrap, and packaging can be significant. A small change in input costs can quickly reduce profitability. Manufacturers should track contribution margin per unit and contribution margin ratio together. The per-unit number helps with production planning, while the ratio helps compare product lines.
How To Use CM Ratio For Break-Even Analysis
Break-even analysis shows how much revenue you need before the business stops losing money. The formula is:
If your fixed costs are $50,000 per month and your contribution margin ratio is 40%, your break-even sales are $125,000. That means you need $125,000 in monthly revenue before you cover fixed costs. This is powerful because it shows how much sales can fall before the business becomes unprofitable. In an uncertain economy, knowing this number helps you make safer decisions about hiring, discounts, expansion, and product launches.
If your break-even sales feel too high, you have three main levers. You can increase price, reduce variable costs, or lower fixed costs. You can also shift attention toward products with a stronger CM ratio.
Conclusion
Contribution margin ratio isn't just a classroom formula. It is a practical management tool that helps you see which products, services, and channels deserve more attention. Start by reviewing the lowest CM ratio products in your portfolio. If they can't be improved through pricing, supplier negotiation, packaging changes, or process efficiency, consider reducing focus on them. The goal isn't only to sell more. The goal is to sell more of what actually contributes to profit.
Related Articles
Contribution Margin Income Statement: Format, Formula And Examples