
The fixed asset turnover ratio measures how efficiently a company uses fixed assets such as buildings, machinery, equipment, and PP&E to generate net sales.
For CFOs, investors, and analysts, this ratio answers one critical question: how much revenue does each $1 invested in fixed assets create?
Fixed asset turnover is useful because it connects capital spending with operating performance. It helps show whether factories, warehouses, store networks, vehicles, and equipment are being used productively. Still, the number only becomes meaningful when compared with peers, industry norms, asset age, and recent capital expenditure patterns.
What Is Fixed Asset Turnover Ratio?
The fixed asset turnover ratio is an efficiency ratio that compares net sales with average net fixed assets. It focuses only on long term physical assets, not all assets on the balance sheet. That makes it more precise than total asset turnover when analyzing asset heavy businesses.
Fixed assets usually include property, plant, and equipment. These are the assets a company uses repeatedly to produce goods, deliver services, store inventory, or support operations. In accounting terms, these assets appear on the balance sheet at book value after accumulated depreciation. For example, if a manufacturer produces $20 million in net sales and has average net fixed assets of $5 million, its fixed asset turnover ratio equals 4.0x. That means every $1 invested in net fixed assets generates $4 in revenue.
The ratio is especially useful when management needs to evaluate whether past Capex decisions are paying off.
The Exact Fixed Asset Turnover Formula
To calculate the FAT ratio correctly, use information from both the income statement and the balance sheet.
Net sales represent total revenue after deducting returns, discounts, and allowances. This figure is better than gross sales because it reflects the revenue the company actually keeps.
Average net fixed assets are calculated as follows:
The word net matters. Net fixed assets equal gross PP&E minus accumulated depreciation. If a company owns equipment with an original cost of $10 million and accumulated depreciation of $4 million, the net book value is $6 million.
Here is a simple calculation.
- Net Sales: $50 million
- Beginning Net Fixed Assets: $9 million
- Ending Net Fixed Assets: $11 million
Average Net Fixed Assets = ($9M + $11M) / 2 = $10M
Fixed Asset Turnover Ratio = $50M / $10M = 5.0x
The company generates $5 in net sales for every $1 of average net fixed assets.
The Depreciation Trap: Why Older Companies Look Better
One of the biggest mistakes in fixed asset turnover analysis is assuming that a higher ratio always means better performance.
Because the denominator uses book value, accumulated depreciation can make older assets appear artificially efficient. A company with twenty year old machinery may have a very low net fixed asset base because most of its equipment has already been depreciated. As a result, the ratio can look extremely high even if the machines are outdated, inefficient, or close to replacement.
On the other hand, a company that recently built a modern factory may report a lower fixed asset turnover ratio because its net fixed asset base is much larger. That doesn’t automatically mean poor performance. It may simply mean the company has invested ahead of future growth.
This is why analysts shouldn’t read the ratio alone. They should review capital expenditures, depreciation expense, plant utilization, maintenance costs, and revenue growth together. A rising ratio can mean better efficiency. It can also mean aging assets. A falling ratio can mean poor utilization. It can also mean a major expansion that hasn’t reached full capacity yet.
Industry Context: Who Actually Uses This Ratio?
Fixed asset turnover is most useful in capital intensive industries. These businesses require heavy investment in physical assets before revenue can be produced.
In manufacturing, the ratio helps evaluate factory productivity and equipment utilization. In telecom, it helps assess whether fiber networks, towers, and infrastructure are generating enough sales. In logistics, it can show how effectively vehicles, warehouses, and distribution centers are being used. In retail, it helps evaluate stores, fulfillment centers, and warehouse networks.
The ratio is far less useful for software, consulting, digital media, and other asset light businesses. These companies often rely more on talent, code, brand, data, or intellectual property than physical fixed assets. Since their PP&E base is small, fixed asset turnover may look unusually high but reveal very little about true business quality. The correct question is whether the ratio is healthy for that industry, business model, and investment cycle.
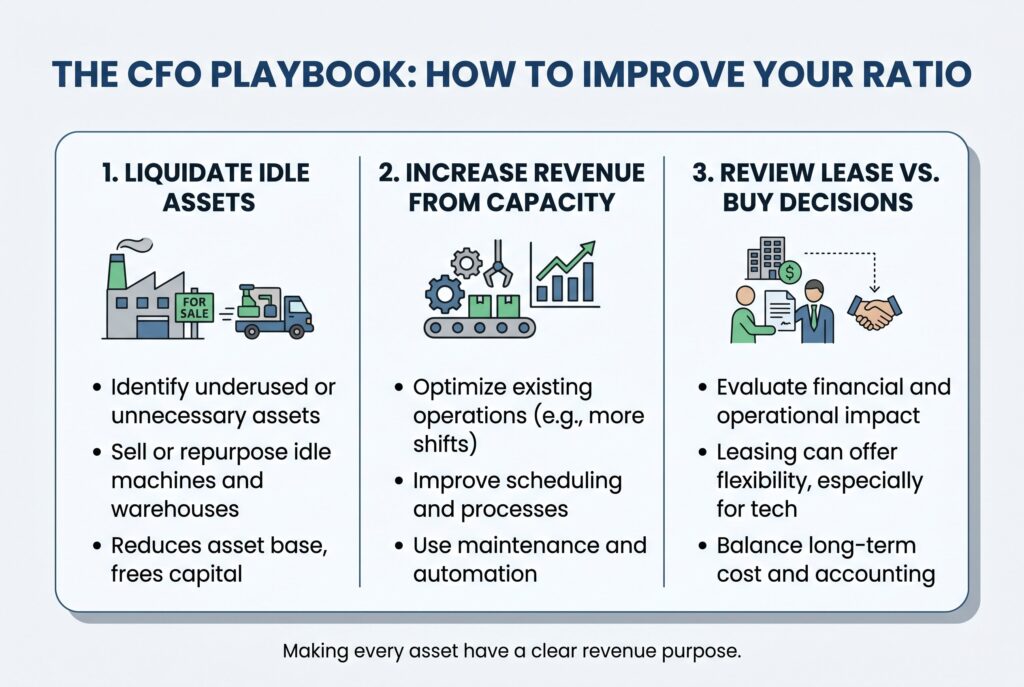
The CFO Playbook: How to Improve Your Ratio
If fixed asset turnover is weak compared with peers, management should investigate whether assets are underused or unnecessary.
Step 1: Liquidate Idle Assets
Organizations can improve fixed asset turnover by identifying and selling underutilized equipment, facilities, or other assets that no longer support business objectives. Reducing idle assets lowers the fixed asset base and releases capital for more productive uses.
Step 2: Increase Revenue from Existing Capacity
Another way to improve asset efficiency is to generate more output from existing resources. This may involve expanding production schedules, optimizing workflows, improving maintenance practices, or adopting automation to increase sales without significant new capital investment.
Step 3: Evaluate Lease vs. Buy Decisions
Businesses should carefully assess whether leasing or purchasing assets provides the greatest value. Leasing can offer flexibility and reduce capital commitments, while purchasing may be more cost-effective over the long term. The decision should consider operational needs, accounting implications, and total lifecycle costs.
Improving the ratio isn’t about starving the business of investment. It’s about making sure every major asset has a clear revenue purpose.
Conclusion
The fixed asset turnover ratio is a powerful tool for measuring how effectively a company turns physical assets into revenue. It gives CFOs, investors, and analysts a direct view of Capex efficiency and operating performance.
Still, it shouldn’t be read in isolation. A high fixed asset turnover ratio can signal excellent asset productivity, but it can also warn that the company hasn’t reinvested enough. A low ratio can suggest weak utilization, but it can also reflect a new factory, upgraded equipment, or expansion capacity that hasn’t matured yet.
The best analysis combines fixed asset turnover, capital expenditure trends, depreciation, industry comparison, and revenue growth. When viewed together, these signals reveal whether a company is truly efficient or merely benefiting from old accounting values. In the end, fixed asset turnover isn’t just a formula. It’s a financial lens for judging whether long term investments are creating enough sales to justify the capital behind them.