
When evaluating business performance, the asset turnover ratio is one of the most important financial ratios to understand. So what is asset turnover? It measures how efficiently a company uses its assets to generate revenue. In simple terms, it shows how many dollars of net sales are produced for every dollar invested in assets.
Whether you’re analyzing a public company, managing a growing enterprise, or learning financial analysis for the first time, understanding asset turnover can reveal how effectively management converts resources into revenue. While the calculation is straightforward, the real value comes from knowing how to interpret the result within the proper business context.
What Is Asset Turnover Ratio?
The asset turnover ratio is a financial metric that measures how efficiently a company uses its assets to generate sales. Often referred to simply as asset turnover or total asset turnover, the ratio evaluates the relationship between revenue and the assets required to produce that revenue.
For example, if a company generates $2 million in annual net sales while maintaining average total assets of $1 million, its asset turnover ratio equals 2.0x. This means every dollar invested in assets produces $2 of revenue.
Investors often use asset turnover to evaluate operating efficiency because it provides insight into how effectively management utilizes company resources. A higher ratio typically suggests stronger operational performance, while a lower ratio may indicate underutilized assets, excess inventory, or inefficient capital allocation. However, a high ratio isn’t always positive and a low ratio isn’t always negative. The interpretation depends heavily on industry comparison, business model, and long term strategy.
Deconstructing the Total Asset Turnover Formula
At first glance, the asset turnover ratio formula appears simple. Yet many investors calculate it incorrectly because they misunderstand the underlying components.
The standard total asset turnover formula is:
Let’s break down each component.
Net Sales
Net sales come directly from the Income Statement. This figure represents total revenue after customer returns, discounts, and allowances have been deducted. Using gross sales instead of net sales can overstate operating efficiency and distort comparisons with competitors.
Average Total Assets
Average total assets are derived from the Balance Sheet. Instead of using ending assets only, analysts calculate average total assets to smooth out fluctuations caused by acquisitions, asset purchases, or divestitures.
The formula is:
Using average total assets creates a more accurate picture of asset utilization throughout the reporting period.
Asset Turnover Calculation Example
Assume a company reports:
- Net Sales: $120 million
- Beginning Assets: $50 million
- Ending Assets: $70 million
Average Total Assets:
($50M + $70M) / 2 = $60M
Asset Turnover Ratio:
$120M / $60M = 2.0x
This means the company generated $2 of revenue for every $1 invested in assets.
Industry Benchmarks: Why Context Is Everything
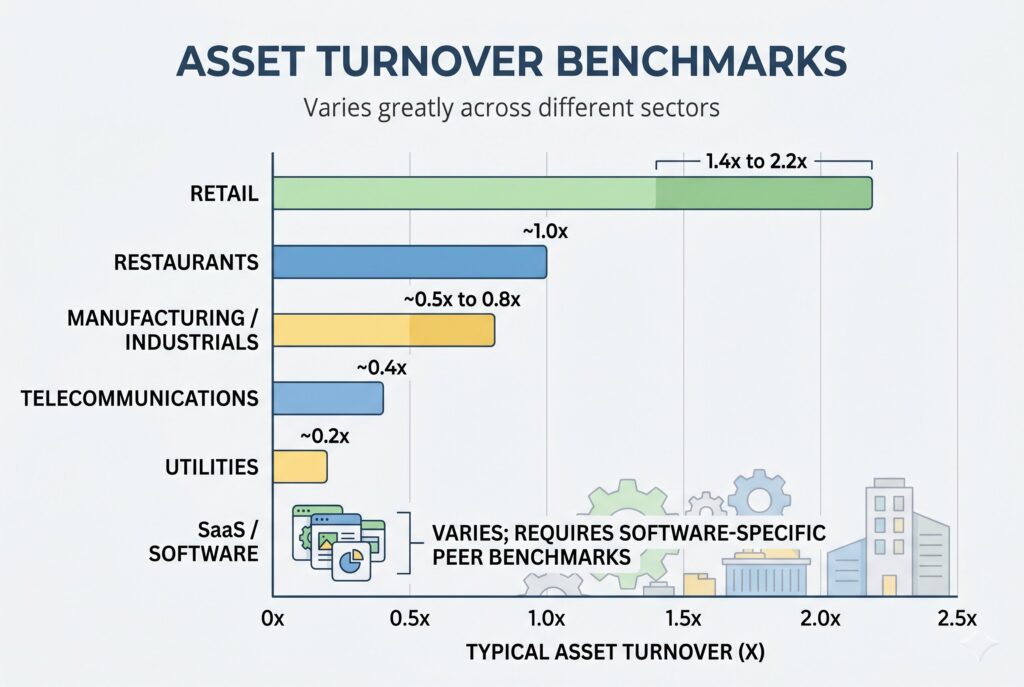
One of the most common mistakes in financial analysis is comparing asset turnover ratios across unrelated industries. Different industries require different levels of investment in inventory, equipment, facilities, and infrastructure. As a result, expected total asset turnover levels vary dramatically.
| Industry | Typical Asset Turnover |
| Retail | ~1.4x to 2.2x |
| Manufacturing / Industrials | ~0.5x to 0.8x |
| Restaurants | ~1.0x |
| Telecommunications | ~0.4x |
| Utilities | ~0.2x |
| SaaS / Software | Varies; often better assessed with software-specific peer benchmarks |
Note: Benchmarks are indicative ranges based on public-company financial ratio data from ReadyRatios SEC industry ratios for 2025 and Wisesheets’ 2026 TTM asset turnover benchmarks. Actual ratios vary by company size, accounting method, asset intensity, and business model.
Fixed Asset Turnover Ratio
While the total asset turnover ratio measures efficiency across all assets, analysts often need a more focused view.
The fixed asset turnover ratio isolates the performance of long term operating assets such as buildings, machinery, manufacturing facilities, and equipment.
The formula is:
Unlike total asset turnover, fixed asset turnover focuses only on Property, Plant, and Equipment (PP&E). This makes it particularly useful for capital-intensive industries where significant investments in facilities, machinery, and equipment drive operations.
For example, if a manufacturer invests heavily in a new production facility, the ratio helps measure whether the additional assets generate enough revenue to justify the investment. A higher ratio indicates more efficient use of fixed assets, while a declining ratio may suggest underutilized resources or ineffective capital spending.
The CFO Playbook: Diagnosing & Boosting Efficiency
Understanding a ratio is one thing. Improving it is another.
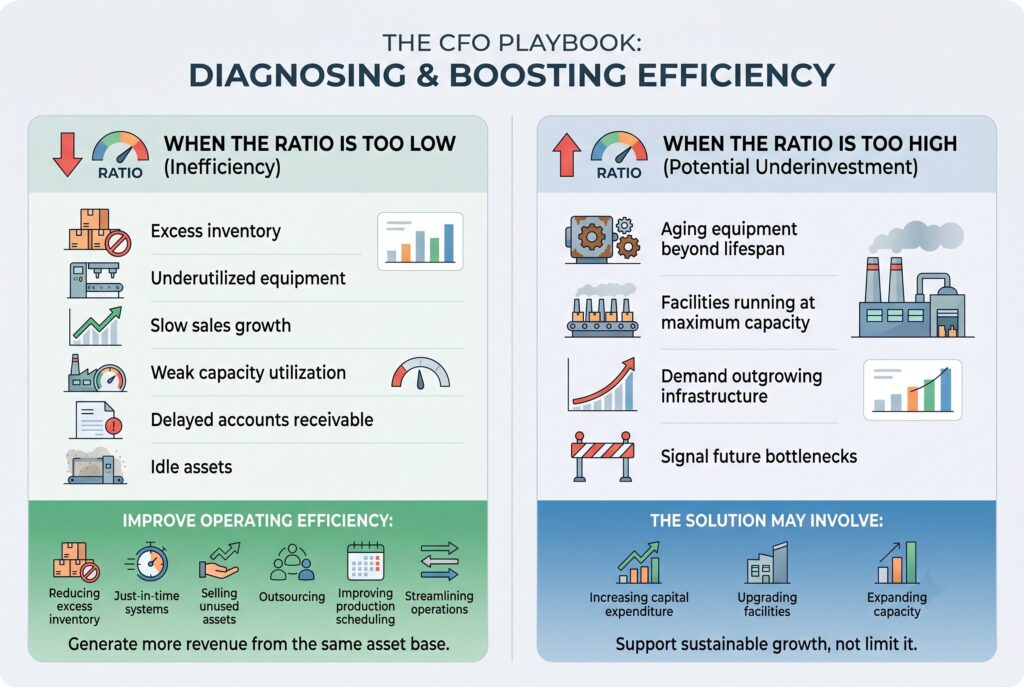
When the Ratio Is Too Low
A low asset turnover ratio often points toward inefficiency.
Common causes include:
- Excess inventory sitting in warehouses
- Underutilized equipment
- Slow sales growth
- Weak capacity utilization
- Delayed accounts receivable collection
- Idle assets generating little value
Business leaders can improve operating efficiency by:
- Reducing excess inventory
- Implementing just in time inventory systems
- Selling unused assets
- Outsourcing noncore functions
- Improving production scheduling
- Streamlining operations
The objective is simple: generate more revenue from the same asset base.
When the Ratio Is Too High
Many people assume higher is always better. That’s not always true. An unusually high asset turnover ratio can sometimes indicate under-investment. The company may be operating aging equipment beyond its optimal lifespan. Production facilities may be running at maximum capacity. Demand could be growing faster than infrastructure investments.
In these situations, a very high ratio may signal future bottlenecks rather than superior performance. The solution may actually involve increasing capital expenditure, upgrading facilities, or expanding capacity. Strong operating efficiency should support sustainable growth, not limit it.
Asset Turnover and DuPont Analysis
One reason analysts pay close attention to asset turnover is its role within DuPont Analysis.
The DuPont framework breaks Return on Equity into three drivers:
ROE = Profit Margin × Asset Turnover × Financial Leverage
This model demonstrates that profitability doesn’t depend solely on margins. A retailer may generate a very high asset turnover ratio but operate with thin profit margins. A telecommunications company may have a low asset turnover ratio but generate substantial profit margins.
Both businesses can ultimately produce similar shareholder returns through different economic models. This is why asset turnover should always be analyzed alongside profit margin rather than in isolation.
Common Mistakes When Using Asset Turnover
Even experienced investors occasionally misuse this metric.
The most common mistakes include:
- Comparing unrelated industries
- Using ending assets instead of average total assets
- Ignoring acquisitions and asset sales
- Assuming higher ratios are always better
- Focusing on one year instead of long term trends
- Ignoring profitability metrics
Asset turnover becomes significantly more powerful when combined with trend analysis, peer comparison, and broader financial evaluation.
Conclusion
The asset turnover ratio remains one of the most valuable measures of operating efficiency. It reveals how effectively a company converts its asset base into revenue and provides insight into management performance, capital allocation, and business productivity.
However, the ratio shouldn’t be viewed in isolation. Industry structure, growth strategy, profit margins, and capital intensity all influence what constitutes a healthy result. The most effective approach is to combine asset turnover, fixed asset turnover ratio, profit margin analysis, and DuPont Analysis into a single framework. Together, these metrics create a much clearer picture of corporate performance.