
Assessing a company’s leverage requires more than looking at total borrowings. Cash on the balance sheet can significantly offset debt obligations, making the headline debt figure an incomplete measure of financial risk. As a result, analysts often focus on net debt when evaluating a company’s capital structure, liquidity position, and valuation.
What Is Net Debt?
In plain English, net debt is the debt left over if a company used its available cash and cash equivalents to pay down borrowings today. The net debt formula helps investors, lenders, and M&A analysts understand true leverage, liquidity, and the bridge between enterprise value and equity value.
Deconstructing the Net Debt Formula
The standard net debt formula is simple:
Net Debt = Short Term Debt + Long Term Debt − Cash and Cash Equivalents.
- Short term debt includes borrowings due within 12 months. This may include current portions of bank loans, short term notes, revolving credit balances, and other interest bearing obligations that must be repaid soon.
- Long term debt includes loans, bonds, notes, and other borrowings due after one year. These obligations may not create immediate pressure, but they still represent claims against the business.
- Cash and cash equivalents include cash in bank accounts, money market holdings, treasury bills, and other highly liquid instruments that can be converted into cash quickly.
The key idea is that net debt doesn’t ask, “How much does the company owe?” It asks, “How much would still be owed after available cash is used?”
Net Debt Calculation Example
Assume a company has the following balance sheet items:
Short term debt of $40 million.
Long term debt of $260 million.
Cash and cash equivalents of $90 million.
Net Debt = $40 million + $260 million − $90 million.
Net Debt = $210 million.
This means the company has $300 million of total debt, but its true net borrowing burden is $210 million after considering available cash.
If the same company had $350 million of cash and only $300 million of debt, it would have negative net debt of $50 million. That means cash exceeds borrowings. Negative net debt isn’t automatically good in every case, but it usually signals stronger liquidity and lower near term financial pressure.
The Practitioner’s Trap: Beware of Restricted Cash
Many beginner investors make one mistake during net debt calculation. They subtract the entire cash balance from total debt without checking whether all that cash is truly available.
That can be dangerous. Restricted cash is money a company holds but can’t freely use to repay debt. It may be tied to legal obligations, customer deposits, collateral requirements, regulatory reserves, escrow accounts, or project financing agreements.
If a company reports $100 million of cash but $30 million is restricted, only $70 million should usually be treated as available cash for net debt purposes.
A cleaner calculation would be:
Net Debt = Total Debt − Unrestricted Cash.
This adjustment matters in real valuation work. If you subtract restricted cash incorrectly, you may understate leverage and overvalue the equity.
Net Debt vs Total Debt
Total debt shows the full amount of borrowings before considering liquid resources. Net debt adjusts that number by subtracting available cash. Both numbers matter. Total debt shows gross obligations. Net debt shows the practical burden after cash support.
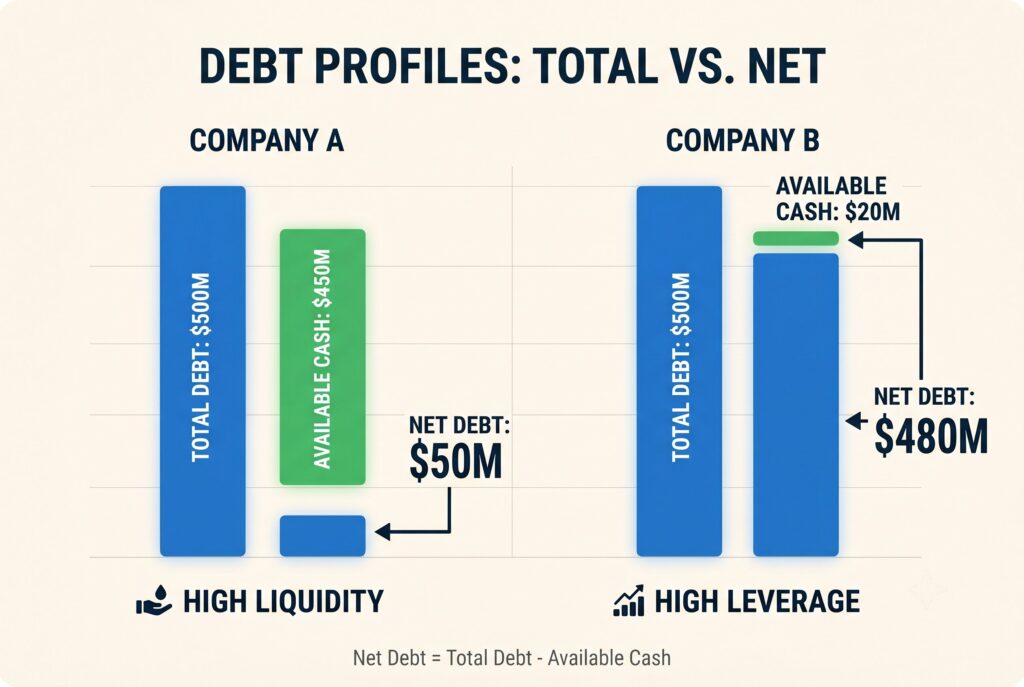
For example, Company A has $500 million of debt and $450 million of cash. Company B has $500 million of debt and $20 million of cash. Looking only at total debt makes them appear similar. Net debt tells a different story.
Company A has net debt of $50 million.
Company B has net debt of $480 million.
That difference changes how investors judge liquidity, leverage, credit risk, and acquisition value.
The Valuation Bridge: EV to Equity Value
In M&A and valuation, net debt is more than a balance sheet ratio. It’s the bridge between enterprise value and equity value.
Enterprise value represents the value of the entire operating business. Equity value represents the value that belongs to common shareholders.
The formula is:
Equity Value = Enterprise Value − Net Debt.
Suppose a buyer values a company’s operations at $1 billion. The company has $250 million of net debt.
Equity Value = $1 billion − $250 million.
Equity Value = $750 million.
That $750 million is the value available to shareholders before deal adjustments, transaction fees, taxes, escrows, and working capital negotiations.
This is why a company can look attractive on enterprise value but deliver far less to shareholders once net debt is deducted.
Real Valuation Example: How Net Debt Affects Shareholder Value

Understanding net debt is important because it directly affects how much of a company’s value belongs to shareholders. In professional valuation, analysts typically estimate a company’s enterprise value (EV) first and then adjust for net debt to determine equity value, which represents the value attributable to shareholders.
To see how this works in practice, let’s walk through a simplified Tesla valuation example using balance sheet data.
Step 1: Calculate Total Debt
When calculating net debt, analysts identify all interest-bearing obligations on the balance sheet rather than looking at a single debt line item.
| Debt Component | Amount (Billions) |
| Current Portion of Long-Term Debt | $2.456 |
| Long-Term Debt | $5.757 |
| Total Debt | $8.213 |
Step 2: Calculate Total Cash
Next, analysts identify highly liquid assets that can be used to repay debt immediately.
| Cash Component | Amount (Billions) |
| Cash and Cash Equivalents | $16.139 |
| Short-Term Investments (Marketable Securities) | $20.424 |
| Total Cash & Investments | $36.563 |
Step 3: Calculate Net Debt
The standard formula is:
Net Debt = Total Debt − Total Cash
Applying the numbers:
Net Debt = $8.213B – $36.563B
Net Debt = –$28.350B
Because the result is negative, Tesla has a net cash position rather than net debt. In other words, the company holds approximately $28.35 billion more cash and liquid investments than debt.
Step 4: Convert Enterprise Value into Equity Value
Suppose an analyst estimates Tesla’s enterprise value at $900 billion using a discounted cash flow model or comparable company analysis.
The relationship between enterprise value and equity value is:
Equity Value = Enterprise Value – Net Debt
Substituting the figures:
Equity Value = $900B – (–$28.350B)
Equity Value = $928.350B
Because Tesla has excess cash, its equity value is higher than its enterprise value. This example highlights why net debt is often called the bridge between enterprise value and equity value.
Enterprise value represents the value of the entire operating business regardless of how it is financed. Net debt then adjusts that value to determine how much ultimately belongs to shareholders.
Two companies may have identical enterprise values but very different equity values. A company carrying significant debt will generally leave less value available to shareholders because lenders have a claim on part of the business. By contrast, a company with substantial excess cash can create additional value for shareholders because that cash belongs to the owners of the business.
As a result, net debt is one of the most important adjustments in real-world valuation models and plays a critical role in mergers and acquisitions, equity research, and investment banking analysis.
Assessing Leverage: Net Debt to EBITDA
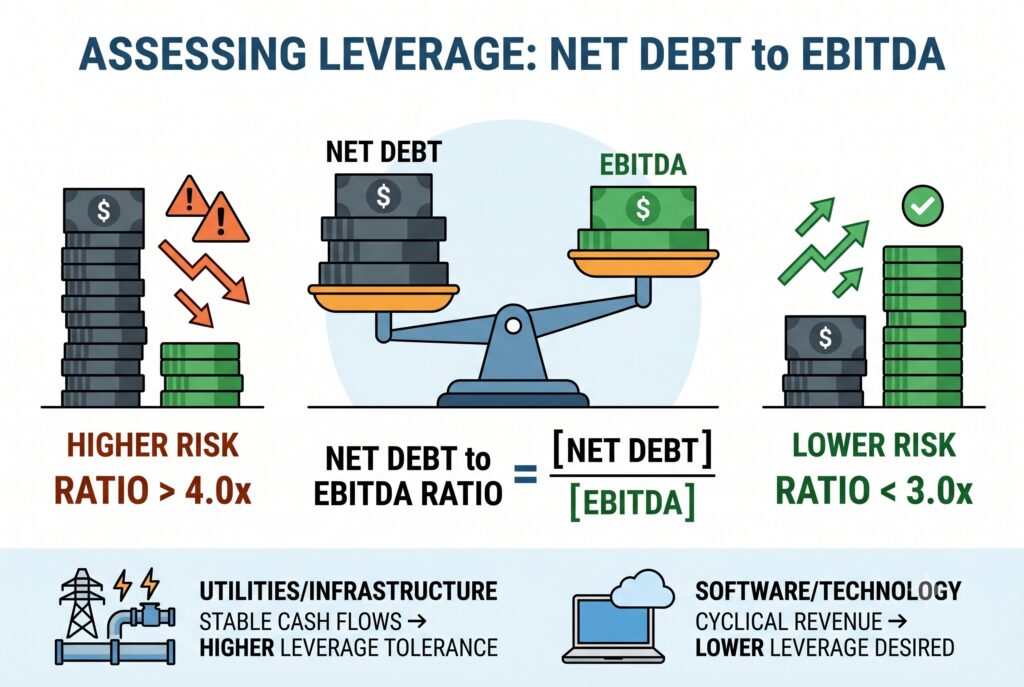
Net debt alone doesn’t tell the full story. A company with $500 million of net debt may be safe if it generates $300 million of EBITDA, but risky if it generates only $50 million.
That is why analysts use the net debt to EBITDA ratio.
This ratio estimates how many years of EBITDA it would take to repay net debt, assuming EBITDA remains stable.
A ratio below 3.0x is often viewed as manageable for many industries. A ratio above 4.0x or 5.0x can raise concern, especially if earnings are cyclical or interest rates are high.
However, industry context matters. Utilities and infrastructure companies may carry more leverage because cash flows are stable. Software businesses may need lower leverage because revenue quality, growth investment, and customer churn matter.
Conclusion
Net debt is one of the clearest ways to understand a company’s real financial burden. It improves on total debt by recognizing that cash can offset borrowings, but it also requires judgment. Not all cash is available. Not all liabilities are debt. Not all companies can support the same leverage.
For investors, net debt helps assess financial health. For lenders, it helps measure credit risk. For M&A analysts, it’s essential in the EV to equity bridge. A company with high total debt may be safer than it looks if cash is abundant. A company with modest debt may be riskier than it appears if cash is restricted and earnings are weak. The best analysis doesn’t stop at the headline number. It checks liquidity, leverage, restricted cash, debt like items, and repayment capacity before making a valuation decision.