 Ratio: The Ultimate Guide to Average Total Assets")
The ROA is one of the clearest ways to judge how efficiently a business turns resources into profit. In simple terms, the return on assets ratio shows how much earnings a company generates from the assets it controls, whether those assets are cash, equipment, inventory, or other operating resources. But to understand the metric properly, you also need to understand average total assets, because that’s what makes the calculation more accurate over a full reporting period. If you want a sharper view of management efficiency, learning how ROA works is a smart place to start.
What Is the Return on Assets (ROA) Ratio?
The return on assets ratio is a profitability metric that measures how efficiently a company uses its assets to generate profit. It answers a practical question: for every dollar invested in assets, how much profit does the company produce? That makes it especially useful for investors, managers, lenders, and analysts who want to evaluate whether the business is putting its resource base to productive use.
A higher ROA usually suggests stronger asset efficiency. In other words, the company is generating more profit relative to the size of its asset base. A lower ROA can suggest weaker efficiency, underused assets, lower margins, or a more capital-intensive business model. Still, the number only becomes meaningful when compared with similar companies or with the same company’s past results. A software firm and a manufacturing plant can have very different asset structures, so comparing their ROA directly can mislead more than it helps.
That’s one of the biggest interpretation rules behind ROA: use it in context. It’s not a universal scorecard that works the same in every sector. It’s a performance measure that becomes more powerful when paired with peer analysis, historical trend tracking, and broader ratio review.
The Standard ROA Formula: How to Calculate Return on Assets
Some simpler explanations use ending total assets instead of average assets, but if you want a more reliable answer, the average approach is usually better. That’s because net income represents profit earned across an entire period, while a balance sheet only shows asset levels at a single point in time. We’ll get into that more in the next section.
If you’re learning how to calculate return on assets, the process is straightforward:
- Find net income on the income statement.
- Find total assets at the beginning and end of the period.
- Calculate average total assets.
- Divide net income by average total assets.
- Multiply by 100 if you want the result as a percentage.
That’s the core ROA formula. For example, if a company reports $500,000 in net income and has average total assets of $5,000,000, its ROA is:
That means the business generated 10 cents of profit for every dollar of assets used during the period.
When people search for how to calculate return on assets, what they often want isn’t just the formula. They want confidence that they’re using the right denominator. That’s exactly why the average-assets step matters so much.
The Secret to Accuracy: Why We Use Average Total Assets
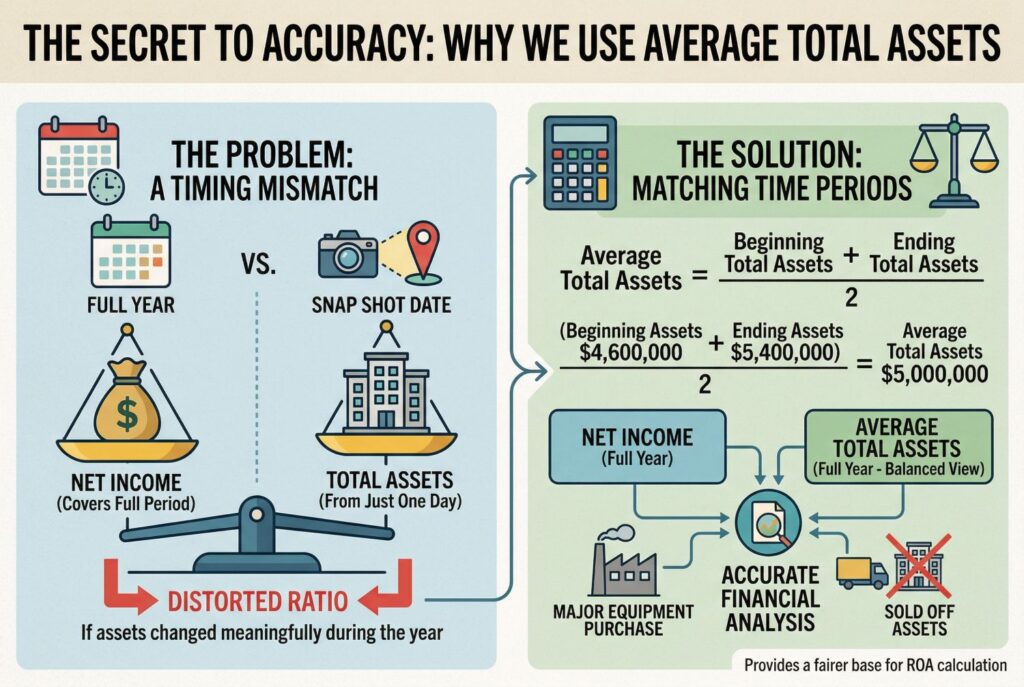
This is where many basic explainers stop too early. If you use net income from a full year and divide it by total assets from just one day, you create a mismatch. The numerator covers a full reporting period. The denominator captures only a snapshot. That can distort the ratio if the company’s asset base changed meaningfully during the year.
That’s why average total assets is the better denominator in most serious analysis.
The formula is:
Average Total Assets = (Beginning Total Assets + Ending Total Assets) / 2
So if a company started the year with $4,600,000 in assets and ended with $5,400,000, the average total assets figure is:
Using average total assets helps match the time period represented by net income. It gives a more balanced view of the resources the company actually used to generate profit over the full year.
This detail may seem small, but it’s one of the biggest things that separates a rough formula lookup from a more accurate financial analysis. If the business bought major equipment, sold off assets, or expanded inventory during the year, average total assets gives a fairer base for the ROA calculation.
Step by Step Calculation: A Real World Example
Let’s walk through a practical example.
Imagine a U.S. company reports the following:
- Net income: $720,000
- Beginning total assets: $8,400,000
- Ending total assets: $9,600,000
First, calculate average total assets:
That means the company generated an 8% return on its average asset base during the year.
This is a much more useful number than simply saying the company made $720,000. Profit alone doesn’t tell you how hard the assets had to work. A business earning $720,000 on a $2 million asset base looks very different from a business earning the same profit on $20 million in assets. That’s why return on assets is such a valuable profitability measure.
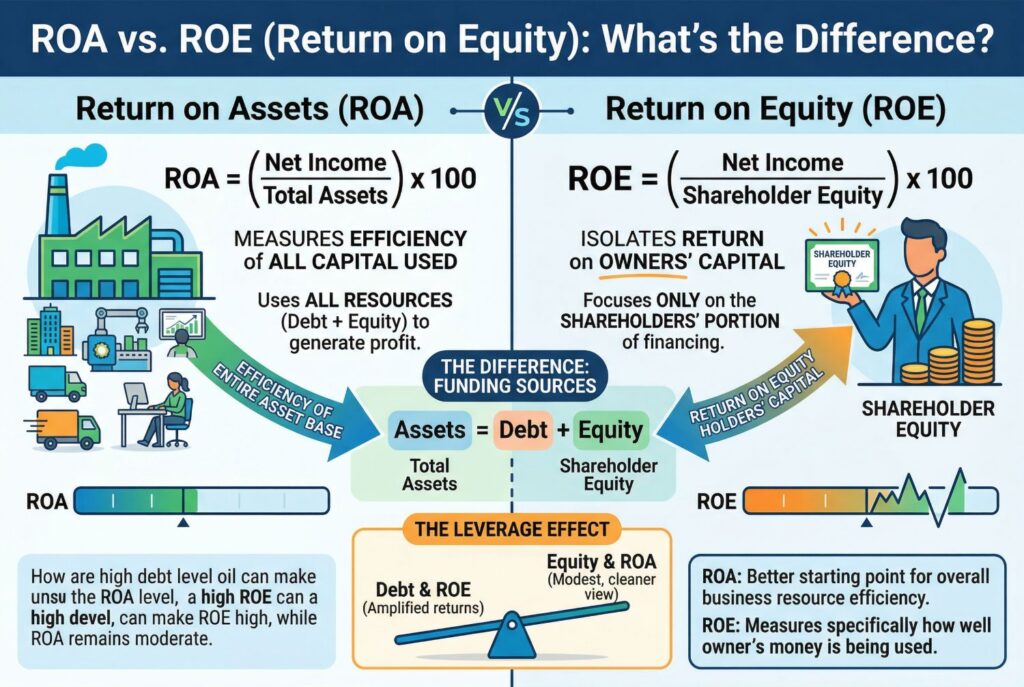
ROA vs. ROE (Return on Equity): What’s the Difference?

Both ROA and ROE measure efficiency, but they focus on different bases. ROA compares profit to total assets. ROE compares profit to shareholder equity. The difference matters because assets are financed by both equity and debt, while equity only reflects the shareholders’ portion. That means ROA captures the efficiency of the whole asset base, while roe isolates the return generated on owners’ capital.
This is why a highly leveraged company can sometimes show a strong ROE while its ROA looks more modest. Debt can amplify returns to equity holders, but it also changes the capital structure. So if you want a cleaner picture of how effectively the business uses all resources, ROA is often the better starting point.
What Is a Good ROA? (Industry Benchmarks and KPI Tracking)

A “good” ROA depends heavily on the industry. A capital-light software company may produce a much higher return on assets ratio than a capital-intensive manufacturer or retailer. That’s why sector comparison matters more than any universal threshold.
Still, a rough directional guide may look like this:
| ROA Range | General Interpretation |
|---|---|
| Below 5% | Often weak, though some industries naturally run lower |
| 5% to 10% | Commonly acceptable in many sectors |
| 10% to 20% | Strong in many business models |
| Above 20% | Very strong, though it can also reflect a low asset base or unusual capital structure |
The smarter move is to track ROA as a recurring KPI. Compare it quarter by quarter, year by year, and against direct competitors. That’s how you turn a ratio into a management tool rather than a one-time formula exercise.
3 Ways to Improve Your Company’s Return on Assets
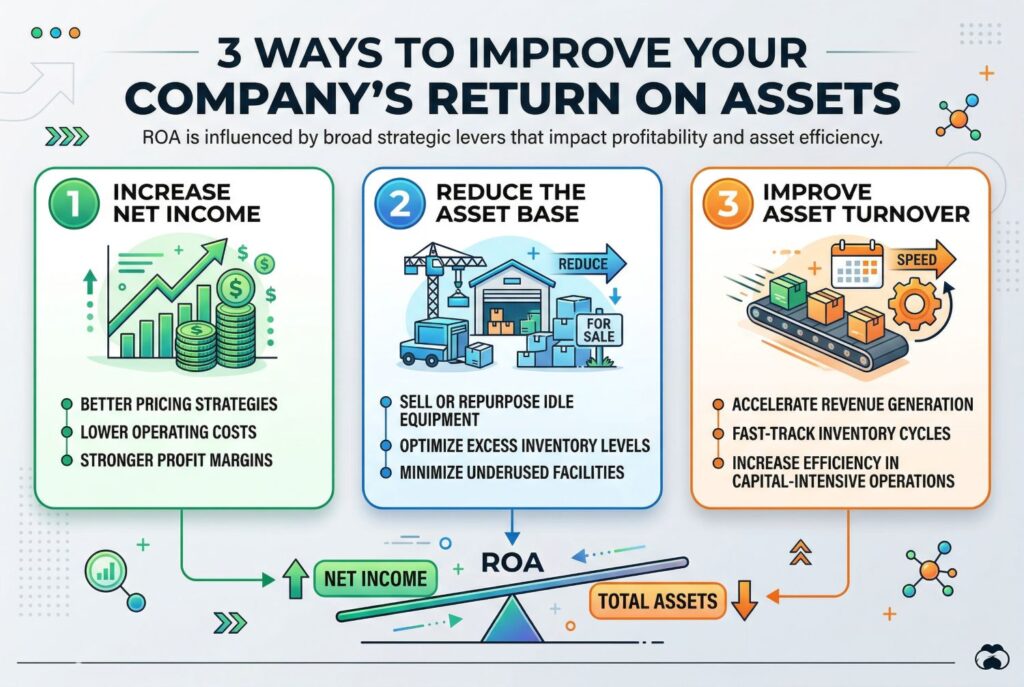
If management wants to improve ROA, there are only a few broad levers. First, increase net income. That can come from better pricing, lower operating costs, or stronger margins.
Second, reduce the asset base where appropriate. Idle equipment, excess inventory, or underused facilities can all drag down asset efficiency. Selling or repurposing those assets can lift the ratio. Third, improve asset turnover. The faster the company turns raw materials, receivables, or physical assets into revenue and profit, the more productive the asset base becomes. This is especially important in inventory-heavy or capital-intensive businesses.
Conclusion

Mastering the ROA formula gives you more than a profitability percentage. It gives you a sharper view of how effectively a company uses its full resource base. And when you calculate it using average total assets, the result becomes much more accurate and analytically useful.
For investors, managers, and business owners, the return on assets ratio works best when used consistently, compared thoughtfully, and tracked over time. That’s what turns ROA from a textbook concept into a real measure of financial efficiency.
Related Articles
Current Ratio Formula: How to Calculate It & What Is a Good Current Ratio?