
Understanding the current ratio formula is one of the simplest ways to assess whether a business can handle its short term bills without running into cash pressure. For investors, founders, and finance teams, this ratio offers a fast look at near term liquidity. It also leads to one of the most common follow-up questions: what is a good current ratio? The answer isn’t one fixed number for every business, because industry, inventory structure, and payment cycles all affect what “healthy” looks like. Still, once you know how the ratio works, it becomes much easier to interpret whether a company looks financially stable or stretched.
What Is the Current Ratio? Meaning Explained
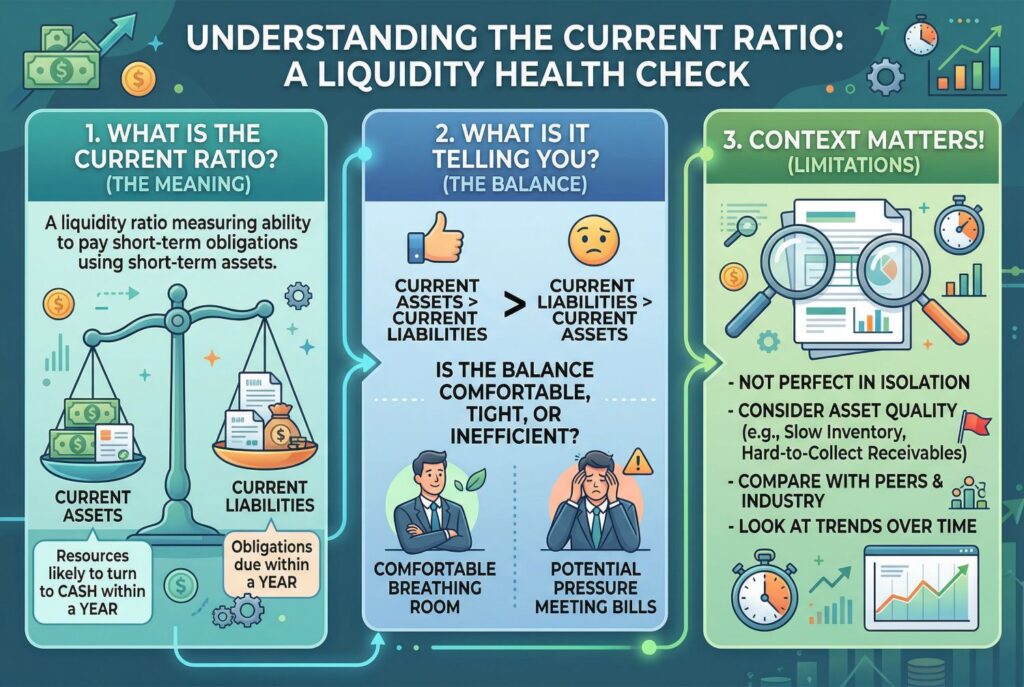
The current ratio meaning is straightforward: it’s a liquidity ratio that measures a company’s ability to pay its short term obligations using its short term assets. In plain English, it shows whether the business has enough resources that are likely to turn into cash within a year to cover liabilities due within that same period. That’s why it’s often used as a quick health check for short term financial stability.
So, what is the current ratio really telling you? It tells you whether the balance between current assets and current liabilities looks comfortable, tight, or potentially inefficient. If current assets are higher than current liabilities, the company usually has more breathing room. If current liabilities are greater, the business may face pressure meeting bills, payroll, supplier payments, or debt coming due.
That said, the ratio shouldn’t be read in isolation. A company can show a decent current ratio on paper while still having weak-quality current assets, such as slow moving inventory or receivables that may be hard to collect. That’s why the metric is useful, but never perfect on its own. Several of the source articles stress that context, peer comparisons, and trends over time matter just as much as the number itself.
The Current Ratio Formula & How to Calculate It
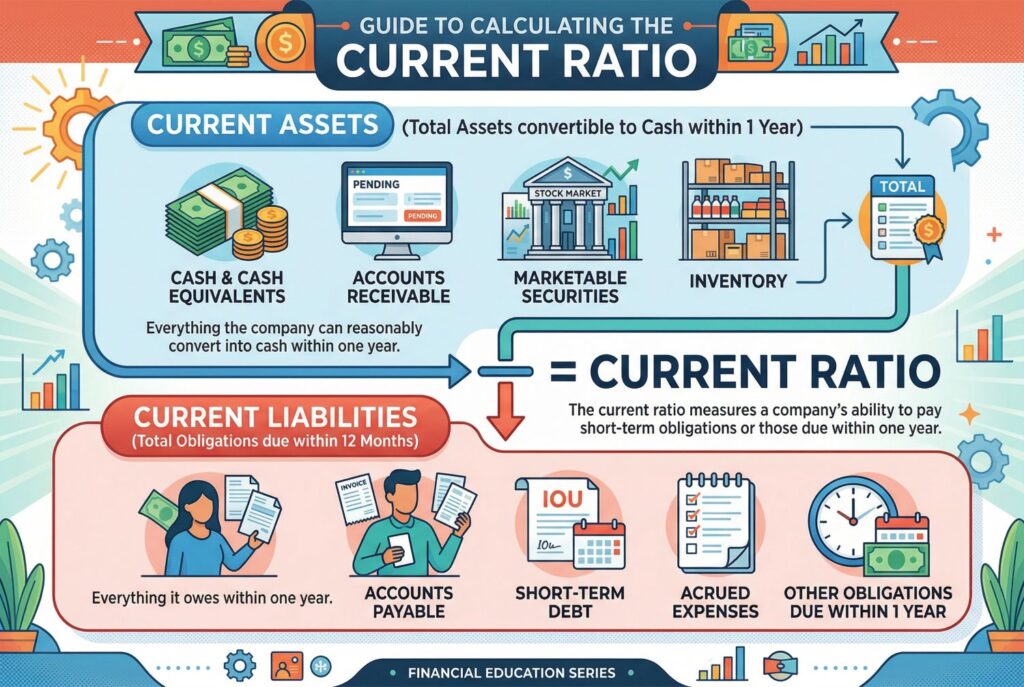
The current ratio formula is:
Current Ratio = Current Assets / Current Liabilities
That’s it. If you want to know how to calculate the current ratio, you divide everything the company can reasonably convert into cash within one year by everything it owes within one year. Current assets often include cash, accounts receivable, marketable securities, and inventory. Current liabilities often include accounts payable, short term debt, accrued expenses, and other obligations due within 12 months.
Here’s a simple example. Imagine a business has:
- $120,000 in current assets
- $80,000 in current liabilities
The calculation is:
120,000 / 80,000 = 1.5
So the current ratio is 1.5. That means the company has $1.50 in current assets for every $1.00 of current liabilities.
This is why the current ratio formula is so popular. It’s easy to compute, easy to explain, and useful in both investing and management contexts. But learning how to calculate the current ratio is only the first step. Interpretation matters more than memorizing the math. A ratio of 1.5 may look solid in one sector and unremarkable in another. A ratio below 1.0 may be a warning sign, but it also isn’t always a disaster if the business model has fast inventory turnover and strong cash conversion.
What Is a Good Current Ratio? Industry Benchmarks
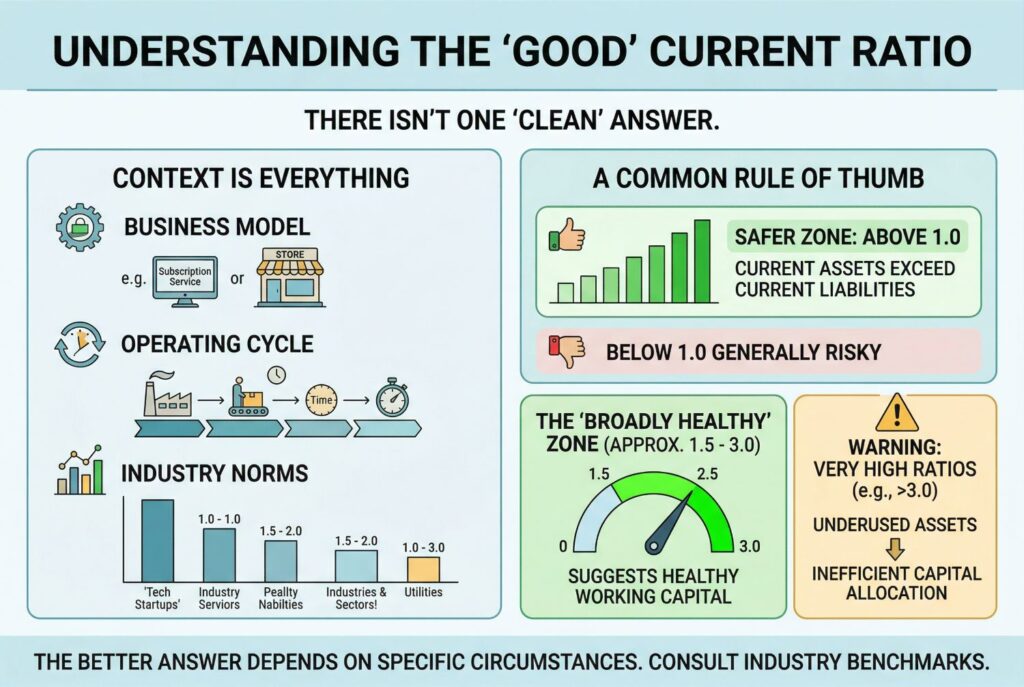
When people ask what is a good current ratio, they usually want one clean answer. In practice, the better answer is that a “good” ratio depends on the business model, operating cycle, and industry norms. Still, many finance guides suggest that a ratio above 1.0 is generally safer than one below 1.0, because it means current assets exceed current liabilities. Some sources also frame roughly 1.5 to 3.0 as a broadly healthy zone, while warning that very high ratios can sometimes signal underused assets or inefficient capital allocation.
A simple benchmark view looks like this:
| Industry Type | Often Acceptable Range | Interpretation |
|---|---|---|
| Retail | 1.0 to 1.8 | Lower ratios can still work if turnover is fast |
| Manufacturing | 1.5 to 2.5 | More inventory and working capital usually require more cushion |
| Technology / SaaS | 1.2 to 2.5 | Asset-light models may not need heavy current asset buffers |
| Wholesale / Distribution | 1.3 to 2.2 | Inventory quality matters a lot |
A dangerously low ratio, especially below 1.0, may suggest the company could struggle to cover short term obligations without new borrowing or a cash infusion. But an excessively high ratio isn’t automatically better. If a business is sitting on too much cash, too much stagnant inventory, or too many idle receivables, that could point to weak capital efficiency rather than strength. That’s one of the most important nuances good finance articles highlight.
Current Ratio vs. Quick Ratio: Understanding the Difference
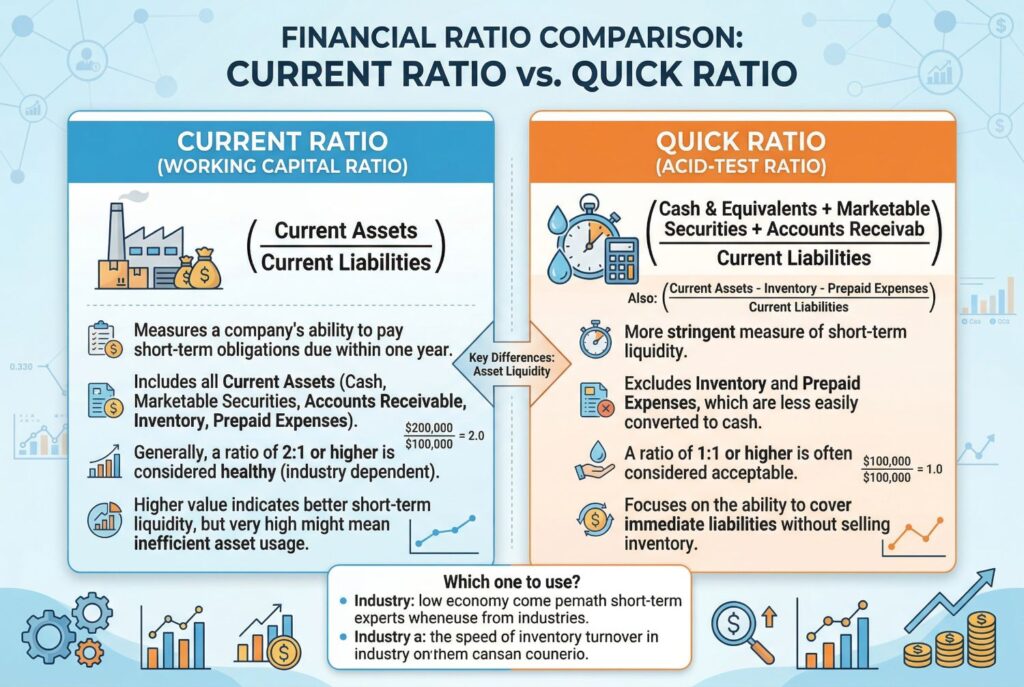
The quick ratio is closely related, but stricter. While the current ratio uses all current assets, the quick ratio removes inventory and other less liquid current assets. In other words, it focuses on quick assets, which are assets that can be converted to cash more quickly and reliably, such as cash, marketable securities, and receivables.
The quick ratio formula is usually:
Quick Ratio = Quick Assets / Current Liabilities
This matters because inventory isn’t equally liquid in every business. A retailer with fast-selling goods may be comfortable counting inventory in a broader liquidity view. A business with obsolete or slow-moving stock may look healthier under the current ratio than it really is. That’s why the quick ratio is often described as a tougher liquidity test. It strips away some of the optimism built into the current ratio and asks, “If inventory isn’t easy to convert quickly, how strong is the company now?”
Action Steps: How to Systematically Improve Your Current Ratio

This is where many glossary-style articles stop too early. If a company has a weak current ratio, the next question isn’t just “What does it mean?” It’s “What should we do about it?”
One of the most effective ways to improve the number is to speed up collections. If customers pay faster, receivables turn into cash sooner, improving liquidity. Another method is reducing slow moving inventory. Liquidating stale stock can convert trapped value into usable cash and reduce the risk of overstating current asset quality. Several practical finance guides also recommend negotiating longer payment terms with suppliers, which can ease short term pressure without immediately hurting operations.

Businesses can also improve the ratio by refinancing short term obligations into longer term debt where appropriate, tightening expense control, or delaying nonessential spending until liquidity improves. The point isn’t to “game” the ratio for appearances. It’s to strengthen the business’s real ability to meet short term obligations consistently.
Conclusion
The current ratio is a useful starting point for understanding short term liquidity. Once you know the current ratio formula, you can quickly assess whether a company’s current assets appear strong enough to cover current liabilities. But the smartest interpretation goes beyond the calculation. You also need to consider asset quality, peer benchmarks, operating patterns, and how the ratio changes over time.
If you’re evaluating a business, don’t treat the current ratio as the whole story. Use it alongside the quick ratio, cash flow analysis, and broader balance sheet review. That’s how the current ratio becomes more than a textbook formula. It becomes a practical tool for better financial judgment.