
A business can look stable on the surface and still be in trouble underneath. That’s exactly why both the debt to assets ratio and current ratio matter. One company may appear safe because it has enough cash and receivables to cover short-term bills, yet still carry so much long-term debt that its overall financial structure is fragile. Another may have valuable assets and low leverage, but not enough liquid resources to survive the next twelve months smoothly. If you want a clearer diagnosis of financial health, you can’t rely on a single metric. You need to understand how liquidity and solvency work together, and where each ratio reveals a different kind of risk.
The Core Difference: Liquidity vs. Solvency Explained
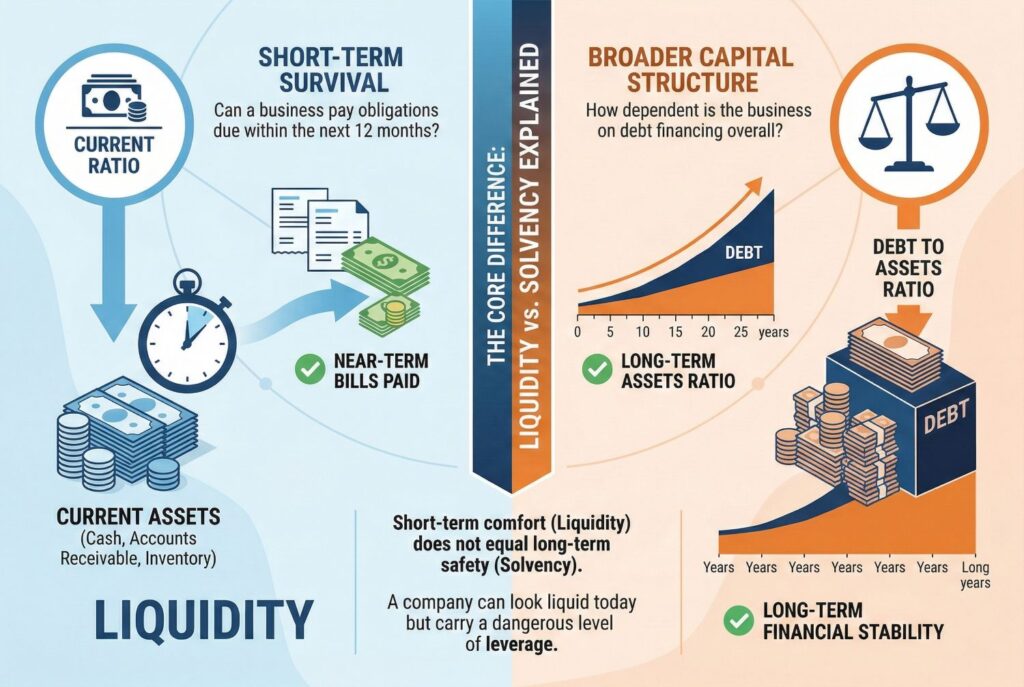
The easiest way to separate these two ratios is to understand the difference between liquidity and solvency. Liquidity is about short-term survival. It measures whether a business can pay obligations due within the next twelve months using current assets such as cash, accounts receivable, and inventory. That’s the job of the current ratio. When people search for current ratio meaning or ask what is current ratio, they’re usually trying to answer one practical question: can this business pay near-term bills without running into a cash crunch?
Solvency is different. It looks at the broader capital structure of the company and asks how dependent the business is on debt financing overall. That’s where the debt to assets ratio becomes important. Instead of focusing on the next year only, it measures how much of the company’s total asset base is financed by debt. A business with strong liquidity can still be weak on solvency if debt has piled up too far.
This distinction matters because short-term comfort doesn’t always equal long-term safety. A company may look liquid today and still be carrying a dangerous level of leverage underneath.
Short-Term Survival: The Current Ratio Formula
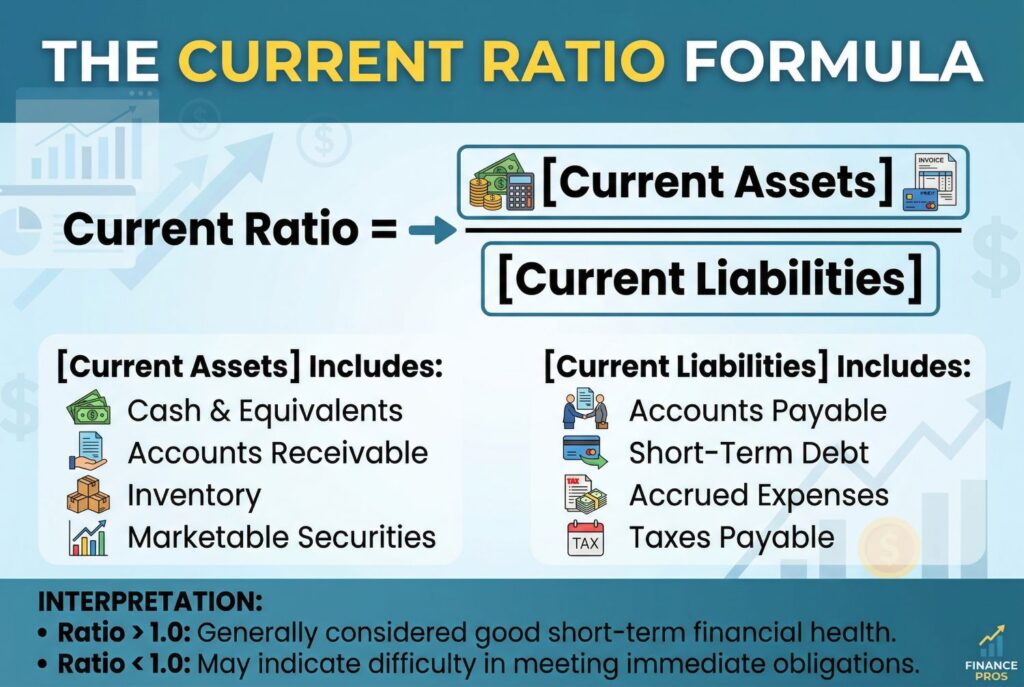
If you want to know how to calculate the current ratio, take all current assets on the balance sheet and divide them by all current liabilities due within the next twelve months. Current assets usually include cash, accounts receivable, short-term investments, and inventory. Current liabilities usually include accounts payable, accrued expenses, short-term loans, and the current portion of long-term debt.
Here’s a simple balance sheet example:
- Cash: $120,000
- Accounts receivable: $80,000
- Inventory: $100,000
- Current assets: $300,000
- Accounts payable: $90,000
- Short-term debt: $60,000
- Accrued expenses: $30,000
- Current liabilities: $180,000
Now apply the current ratio formula:
300,000 / 180,000 = 1.67
That means the company has $1.67 in current assets for every $1.00 of current liabilities. In general, that suggests a decent short-term liquidity position. But even here, context matters. Not all current assets are equally liquid. A business with a ratio above 1 may still face pressure if too much of that number depends on slow-moving inventory or weak receivables.
What Is a Good Current Ratio? (Industry Benchmarks)
One of the most common follow-up questions is: what is a good current ratio?
The truth is there’s no single universal target that works across every sector. A ratio above 1 usually suggests that current assets exceed current liabilities, but that alone isn’t enough for strong interpretation. The right benchmark depends on how the business operates, how quickly it converts assets into cash, and how much working capital the industry typically needs.
A simple benchmark guide looks like this:
| Industry | Often Acceptable Range | Why It Differs |
|---|---|---|
| Retail | 1.5 to 2.0 | Inventory and seasonal working capital needs are higher |
| Manufacturing | 1.3 to 2.0 | More inventory and operating inputs create higher liquidity needs |
| SaaS / Software | 1.0 to 1.5 | Asset-light models can operate with lower current asset buffers |
| Professional Services | 1.2 to 1.8 | Receivables matter more than inventory |
So, what is a good current ratio? For many businesses, something between 1.2 and 2.0 may be reasonable, but the best comparison is always against industry peers and the company’s own history. A very high number isn’t always good either. It can signal underused cash, excess inventory, or inefficient working capital management.
Long-Term Risk: Understanding the Debt to Assets Ratio
Now shift from short-term liquidity to broader leverage risk.
The debt to assets ratio formula is:
Debt to Assets Ratio = Total Debt / Total Assets
Some lenders and analysts use total liabilities instead of only interest-bearing debt, but the core interpretation stays similar: how much of the asset base is financed by obligations rather than owned capital. The higher the number, the more leveraged the company is.
For example, if a company has:
- Total debt: $900,000
- Total assets: $1,500,000
Then: 900,000 / 1,500,000 = 0.60
That means 60% of the company’s assets are financed by debt. This is where the danger threshold becomes important. If the debt to assets ratio rises above 1.0, or 100%, total debt exceeds total assets. That suggests insolvency, because the company owes more than it owns. At that point, the capital structure is in a severe danger zone.
The Financial Health Matrix: Reading Both Ratios Together
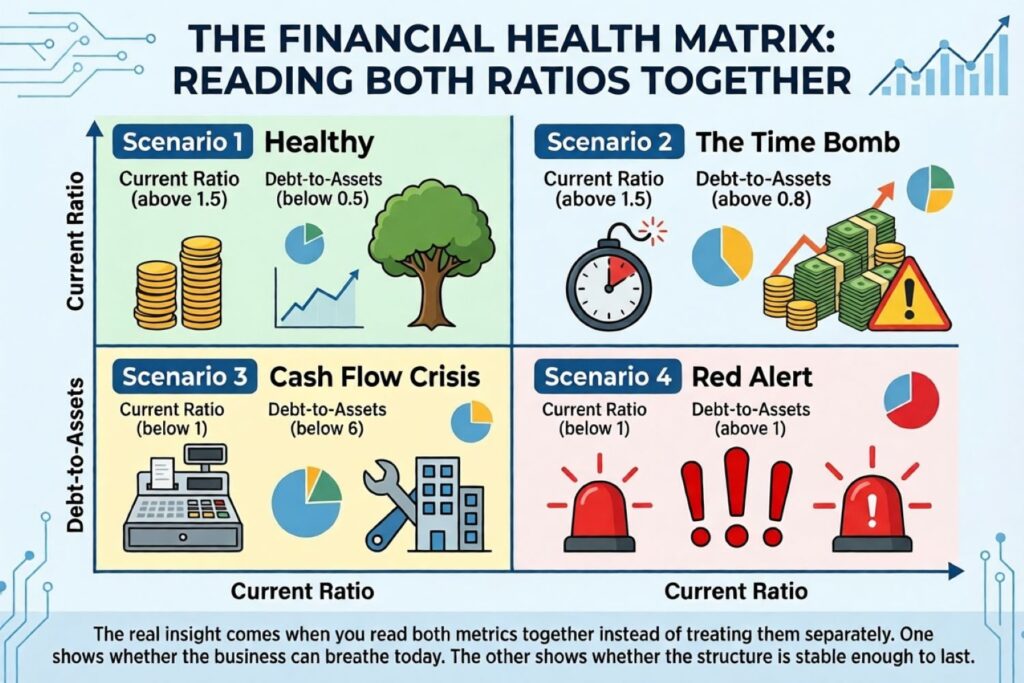
The real insight comes when you read both metrics together instead of treating them separately.
Scenario 1: Healthy
Current Ratio above 1.5 and Debt to Assets below 0.5. This suggests the company has both short-term liquidity and manageable leverage.
Scenario 2: The Time Bomb
Current Ratio is high, but Debt to Assets is above 0.8. This company may look safe today because it has cash, but the balance sheet is heavily leveraged. A downturn, refinancing problem, or revenue slowdown could expose serious long-term risk.
Scenario 3: Cash Flow Crisis
Current Ratio is below 1, but Debt to Assets is low. This business may not be over leveraged at all. Instead, it may have money tied up in property, equipment, or other less liquid assets. The company isn’t necessarily insolvent, but it may struggle to pay near-term bills.
Scenario 4: Red Alert
Current Ratio below 1 and Debt to Assets above 1. This is the clearest danger zone. The company is weak in both short-term liquidity and overall solvency. That’s why these two ratios belong on the same dashboard. One shows whether the business can breathe today. The other shows whether the structure is stable enough to last.
Action Plan: How to Fix Dangerously Low or High Ratios

If the current ratio is too low, management has several options. It can negotiate longer supplier payment terms, collect receivables faster, reduce unnecessary current liabilities, or liquidate slow-moving inventory. These are immediate working capital actions that can strengthen short-term liquidity.
If the debt to assets ratio is too high, the business needs a more structural response. That may include refinancing into more manageable terms, repaying principal with retained earnings, selling underperforming assets, or raising equity capital to reduce leverage. A high leverage ratio can’t usually be fixed by small operational tweaks alone. It often requires capital structure decisions.
Conclusion

A business shouldn’t wait until year-end to review these numbers. The current ratio and debt to assets ratio work best when tracked regularly, ideally as monthly or quarterly KPIs on a financial dashboard. One ratio measures short-term liquidity. The other measures long-term solvency. Together, they give a much more complete picture of whether the business is truly stable or just temporarily comfortable.
If you only track one, you risk missing half the story. But if you monitor both, you’ll spot warning signs earlier, make better financing decisions, and build a more resilient business over time.