
Most investors understand EPS meaning as earnings per share, or the profit a company earns for each share of common stock. But diluted EPS gives a more careful view. It shows what EPS would look like if all potential shares from options, warrants, convertible bonds, or similar securities became real shares. Basic EPS can look attractive, but diluted EPS reveals the “what if” scenario every shareholder should check before trusting the headline number.
What is Earnings Per Share EPS? The Foundation
What is EPS? EPS, or earnings per share, measures how much of a company’s profit belongs to each outstanding share of common stock. A simple EPS definition is this: EPS is net profit expressed on a per share basis. If a company earns $100 million and has 50 million shares outstanding, its EPS is $2. That means each common share represents $2 of company earnings.
EPS matters because investors don’t just care about total profit. They care about how much profit is attached to each share they own. This makes earnings per share a key number for comparing profitability, tracking growth, and calculating valuation ratios like P/E.
Basic EPS vs. Diluted EPS: The Critical Difference
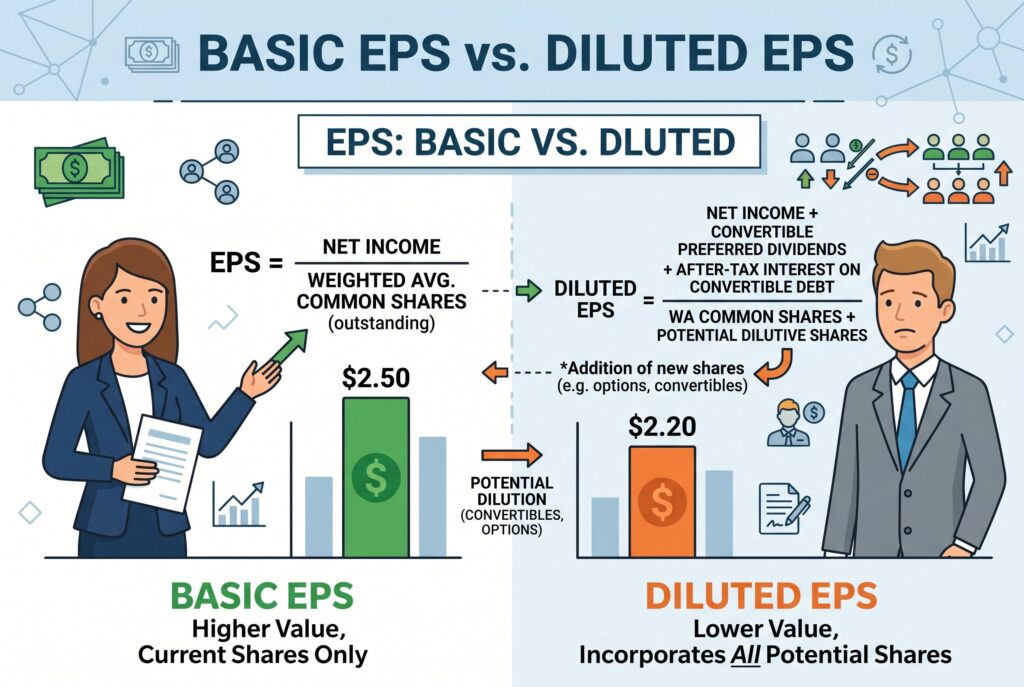
Basic EPS is a snapshot of the present. It uses the current weighted average shares outstanding. Diluted EPS looks ahead and asks what would happen if potential shares became actual shares.
This difference matters because many companies promise future shares through employee stock options, warrants, convertible bonds, restricted stock units, or convertible preferred shares. Basic EPS ignores those possible shares. Diluted EPS counts them when they could reduce profit per share.
In simple terms, basic EPS shows today’s profit per share. Diluted EPS shows a more cautious version of future profit per share. If the gap between basic and diluted EPS is small, dilution risk may be limited. If the gap is large, current shareholders may face meaningful ownership dilution.
The Diluted EPS Formula: How to Calculate It
The diluted EPS formula is:
This is also part of the broader earnings per share formula family. The EPS formula starts with net income, subtracts preferred dividends, then divides the remaining profit by the correct share count. To understand how to calculate earnings per share on a diluted basis, focus on two parts.
The numerator is profit available to common shareholders. That means net income minus preferred dividends. The denominator is the share count. For diluted EPS, it includes weighted average shares plus dilutive securities that could become common shares.
For example, suppose a company has $20 million in net income, no preferred dividends, 10 million common shares, and 2 million potential shares from the money options. Basic EPS is $2. But diluted EPS is $20 million divided by 12 million shares, or $1.67. That lower number gives investors a more conservative view.
Interactive Tool: The EPS Dilution Simulator
EPS Dilution Simulator
Use this simulator to compare Basic EPS and Diluted EPS side by side. Enter net income, preferred dividends, current shares, and potential extra shares from stock options, warrants, and convertible securities.
Basic EPS = (Net Income − Preferred Dividends) ÷ Current Shares
Diluted EPS = (Net Income − Preferred Dividends) ÷ (Current Shares + Options + Warrants + Convertibles)
EPS Drop = ((Basic EPS − Diluted EPS) ÷ Basic EPS) × 100
Note: This simplified simulator treats all stock options, warrants, and convertible securities as additional shares. In formal financial reporting, dilution may require treasury stock or if-converted methods depending on the security type.
An EPS dilution simulator should let users enter net income, preferred dividends, current shares, stock options, warrants, and convertible securities. Then it should compare basic EPS and diluted EPS side by side. The tool should show three outputs: basic EPS, diluted EPS, and the percentage drop caused by dilution.
This matters because dilution can look small until you see the math. A few million extra shares may not sound dramatic, but if profit is divided across a larger share base, each share receives a smaller claim on earnings. A good simulator helps investors see whether EPS growth comes from real profit growth or simply from accounting presentation.
Common Dilutive Securities: The Stealth Shares

Dilutive securities are potential shares that may reduce EPS in the future. They’re sometimes called stealth shares because they don’t always appear in the basic share count.
Stock options are one common example. Companies often grant options to employees, allowing them to buy shares at a fixed price. If the exercise price is lower than the current market price, those options are in the money and may become dilutive. Warrants work in a similar way. They give holders the right to buy shares at a set price. If exercised, they increase the number of shares outstanding.
Convertible bonds are another important example. These are debt instruments that can be converted into common stock. If conversion happens, shareholders face dilution because the share count rises. Convertible preferred shares can also dilute EPS. They may begin as preferred stock but later convert into common shares. Not every potential share is dilutive. If exercising the security would increase EPS or wouldn’t make economic sense, it may be anti-dilutive and excluded from diluted EPS.
Why Diluted EPS Matters More for Valuations

Diluted EPS matters because valuation depends on profit per share. If you calculate a P/E ratio using basic EPS, the stock may look cheaper than it really is.
For example, if a stock trades at $50 and basic EPS is $5, the P/E ratio is 10. But if diluted EPS is only $4, the diluted P/E ratio is 12.5. That is a very different valuation picture. This is why diluted EPS provides a better margin of safety. It reminds investors that other people may already have claims on future shares and future profits.
A company with heavy stock based compensation may show strong basic EPS, but diluted EPS can reveal that shareholders are giving up part of their ownership over time. That doesn’t always make the company bad, but it does mean investors should be careful with valuation.
Real-World Example: High-Growth Tech Companies

High-growth technology companies often use stock compensation to attract employees. This helps preserve cash, but it can increase dilution. Imagine a software company reports $500 million in net income and 250 million basic shares. Basic EPS is $2. But the company also has 50 million potential shares from options and restricted stock units. Diluted shares become 300 million. Diluted EPS is $500 million divided by 300 million, or $1.67.
The company is still profitable, but each share represents less profit once dilution is included. If investors only look at basic EPS, they may overestimate profitability per share and underestimate the true valuation.
Conclusion
Diluted EPS is one of the most important numbers in fundamental analysis. It shows earnings per share after accounting for potential dilution, giving investors a more conservative view than basic EPS. When reading an earnings report, don’t stop at headline EPS. Look for both basic and diluted EPS. Then ask why they differ. If the gap is large, check stock options, warrants, convertible bonds, and stock based compensation. These days, smart investors won’t just ask whether EPS is growing. They’ll ask whether diluted EPS is growing too.