
A business can show profit on paper and still struggle to pay its lender. That’s why the cash coverage ratio matters. It measures whether a company has enough operating cash power to cover its interest payments. Unlike profit based ratios, this metric adds back non-cash expenses such as depreciation and amortization, giving owners, lenders, and investors a clearer view of debt survival.
Cash Coverage Ratio Explained
Cash coverage ratio is a solvency ratio that shows how many times a company can cover interest payments using operating cash capacity. A ratio above 1.2 is generally safer, while a ratio below 1.0 means the business may not generate enough cash to cover interest.
The Illusion of Profit: Why You Need the Cash Coverage Ratio
Profit isn’t always cash. An income statement may show net income after subtracting expenses that don’t actually leave the bank account during the period. Depreciation and amortization are the best examples.
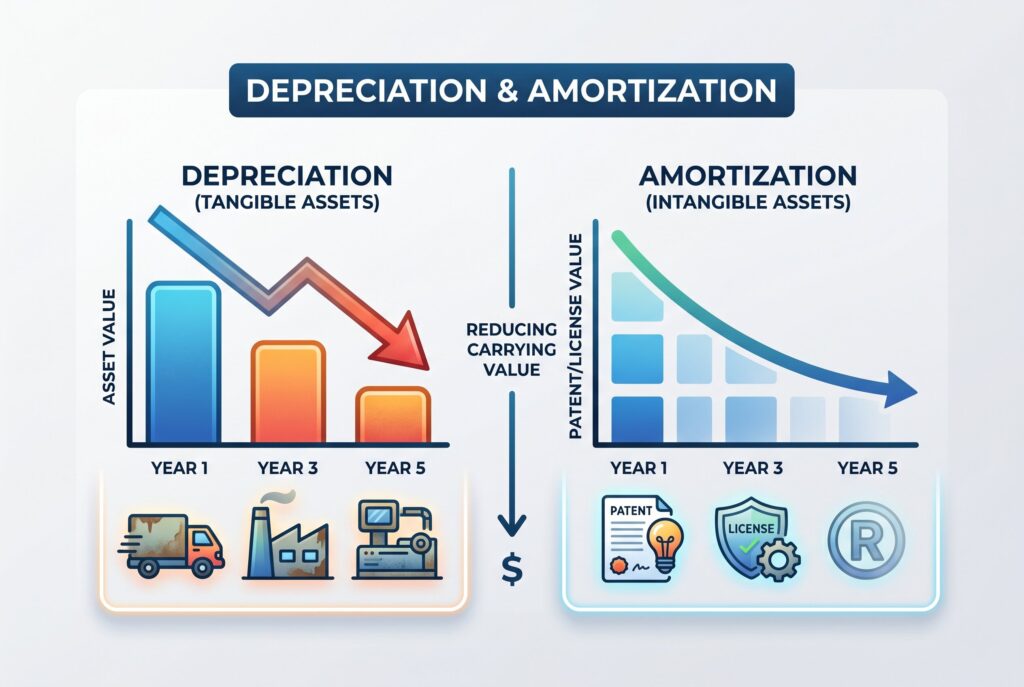
Depreciation reduces accounting profit because equipment, vehicles, buildings, or machinery lose value over time. Amortization works similarly for certain intangible assets. These expenses matter for accounting, taxes, and asset tracking, but they don’t always represent cash leaving the business today.
That’s the problem with looking only at profit. A company may appear weak because depreciation lowers EBIT, but it may still have enough cash capacity to pay interest. The cash coverage ratio helps reveal that difference. For debt analysis, cash is king. Lenders don’t get paid with accounting profit. They get paid with actual available cash.
Cash Coverage Ratio vs. Interest Coverage Ratio
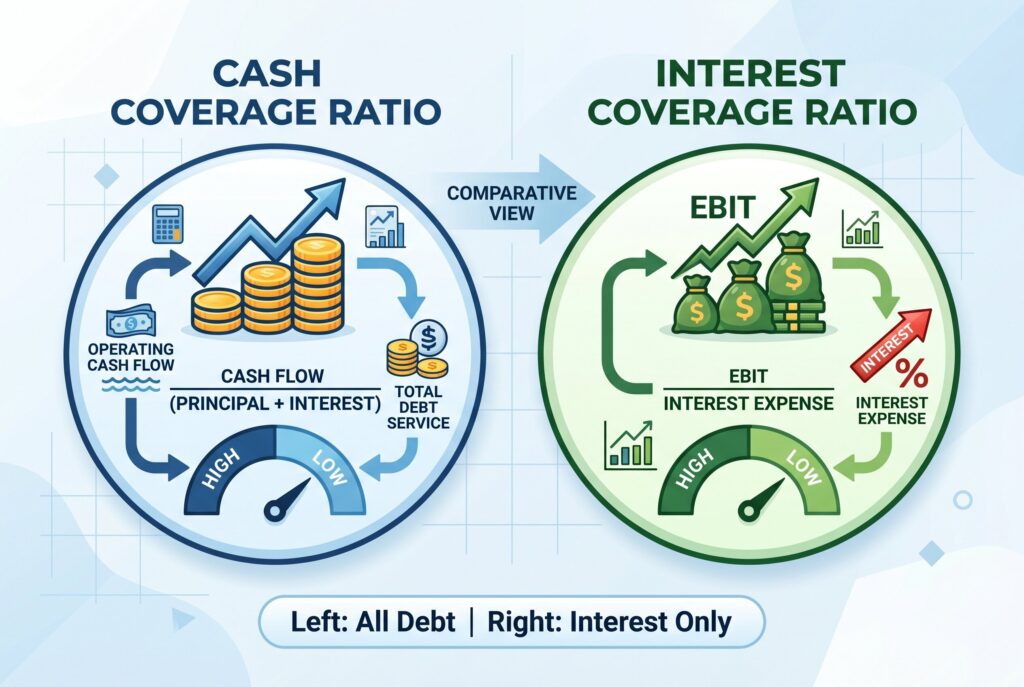
The interest coverage ratio and cash coverage ratio are closely related, but they aren’t the same.
The interest coverage ratio formula is:
Interest Coverage Ratio = EBIT / Interest Expense
This ratio uses EBIT, or earnings before interest and taxes. It shows how many times operating profit can cover interest expense. It’s useful, but it may be too conservative for businesses with large non cash expenses.
The cash coverage ratio uses EBIT plus depreciation and amortization. That makes it more focused on cash generating ability.
Cash Coverage Ratio = EBIT + Depreciation + Amortization / Interest Expense
In simple terms, the interest coverage ratio looks at profit. The cash coverage ratio looks closer to cash. If a business owns expensive equipment, property, or machinery, the cash coverage ratio may give a more realistic picture of liquidity.
Interactive Debt Survival Calculator
An interactive debt survival calculator should ask for four inputs: EBIT, depreciation, amortization, and total interest expense. Once users enter those figures, the calculator should show two results. First, it should calculate the interest coverage ratio. Second, it should calculate the cash coverage ratio.
This side by side view is valuable because it shows whether non cash expenses are making the business look weaker than it really is. A company with a low interest coverage ratio may still have a healthy cash coverage ratio if depreciation is large.
The calculator should also flag risk levels. Below 1.0 should show danger. Between 1.0 and 1.2 should show caution. Above 1.5 should show a more comfortable position for many standard businesses.
The Cash Coverage Ratio Formula Step-by-Step
The cash coverage ratio formula is:
Cash Coverage Ratio = EBIT + Depreciation + Amortization / Total Interest Expense
To calculate it manually, follow these steps.
- First, find EBIT on the income statement. If EBIT isn’t listed, you can calculate it by subtracting operating expenses from gross profit.
- Second, find depreciation and amortization. These may appear on the income statement, cash flow statement, or in the notes to the financial statements.
- Third, find total interest expense. This is usually listed on the income statement. Make sure you include interest from all loans, credit lines, bonds, and debt facilities.
- Fourth, add EBIT, depreciation, and amortization. Then divide the result by total interest expense.
For example, if a company has $80,000 in EBIT, $30,000 in depreciation, $10,000 in amortization, and $40,000 in interest expense, the calculation is:
The cash coverage ratio is 3.0, meaning the business has three times the cash based earnings capacity needed to cover interest.
Real-World Example: The Manufacturing Trap

Imagine a manufacturing company that owns expensive machinery. It reports $40,000 in EBIT and $50,000 in annual interest expense. Its interest coverage ratio is only 0.8. That looks risky. On paper, the company doesn’t earn enough operating profit to cover interest.
But now add $85,000 in depreciation from machinery and $0 in amortization. The cash coverage ratio becomes:
Now the picture changes. The company still needs careful monitoring, but it may not be in immediate cash danger. The low interest coverage ratio was partly caused by depreciation, which reduced accounting profit but didn’t drain cash in the current period.
This is why asset heavy industries often need cash based analysis. Manufacturing, real estate, transportation, utilities, and infrastructure companies may show large depreciation charges that distort profit based debt ratios.
What is a Good Ratio? 2026 Industry Benchmarks
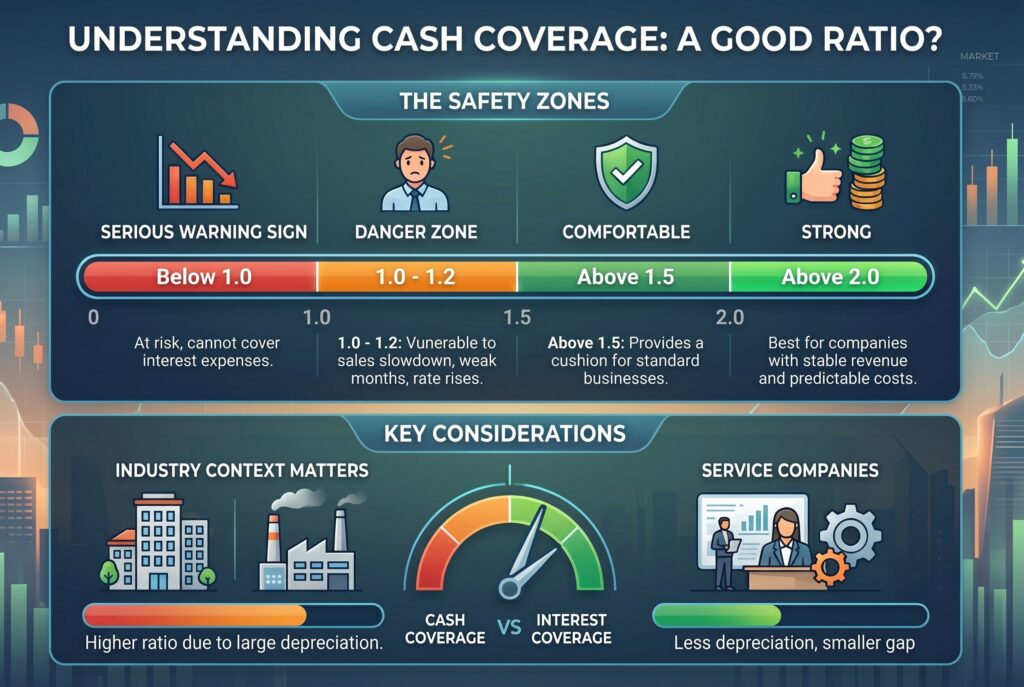
A cash coverage ratio below 1.0 is a serious warning sign. It means the company may not generate enough cash based earnings to cover interest expenses.
A ratio from 1.0 to 1.2 is a danger zone. The business may be able to pay interest, but one weak month, rising rates, or a sales slowdown could create pressure. A ratio above 1.5 is generally more comfortable for many standard businesses. It suggests the company has a cushion. A ratio above 2.0 is stronger, especially for companies with stable revenue and predictable costs.
Industry context matters. Real estate and manufacturing businesses often have higher cash coverage ratios than interest coverage ratios because depreciation is large. Service companies may have less depreciation, so the gap between the two ratios may be smaller.
Conclusion
The cash coverage ratio helps business owners and analysts avoid a dangerous mistake: assuming profit equals payment capacity. Profit matters, but cash pays the bank. Use the cash coverage ratio with the interest coverage ratio, solvency ratios, and cash flow analysis. Together, they show whether a business has enough financial runway to survive debt pressure. A strong company doesn’t just report profit. It produces enough cash capacity to meet obligations, handle surprises, and keep moving forward.