
The interest coverage ratio is one of the clearest ways to measure whether a business can handle its debt. Also called the times interest earned ratio, it shows how many times a company can pay interest expense using its operating earnings. When borrowing costs can shift quickly, this ratio is a practical survival metric for small business owners, finance managers, lenders, and investors.
What is the Interest Coverage Ratio ICR?
The interest coverage ratio measures how many times a company can pay its current interest obligations with its existing earnings. It focuses on interest, not total debt repayment, so it is especially useful for judging short term debt pressure. For example, if a business has $300,000 in EBIT and $100,000 in interest expense, its ICR is 3.0. That means the business earns three times the amount needed to cover interest payments.
From a lender’s perspective, this ratio matters because it reveals repayment safety. A company with a strong interest coverage ratio looks less risky because its earnings provide a larger cushion. A weak ratio may suggest that even a small decline in sales, margin, or cash flow could make debt harder to service.
The Interest Coverage Ratio Formula
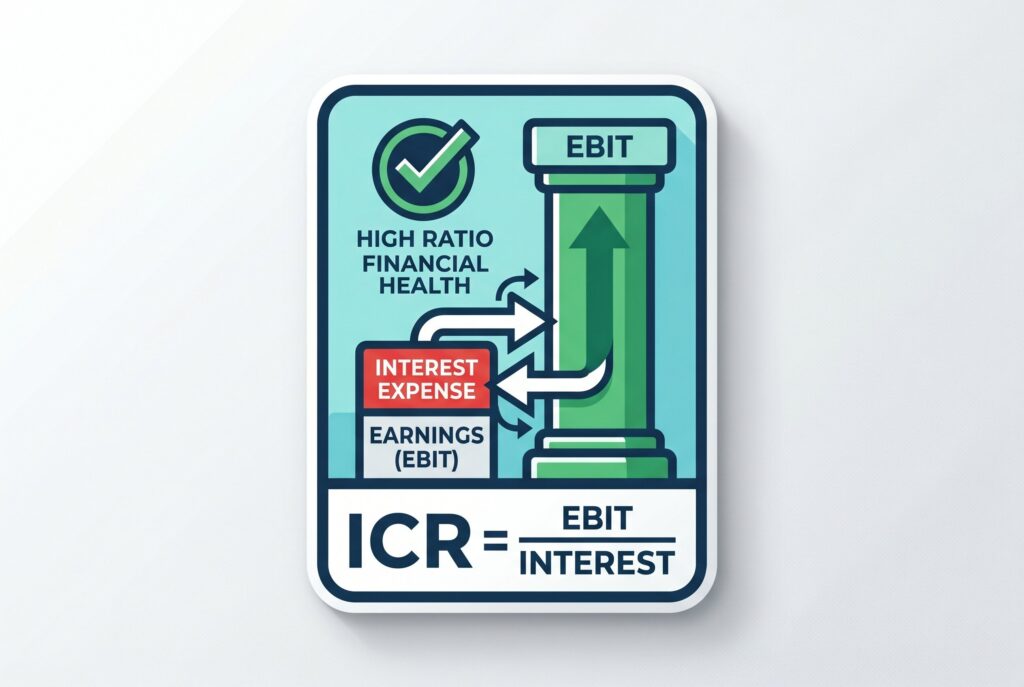
The interest coverage ratio formula is:
EBIT means earnings before interest and taxes. It measures profit from business operations before financing costs and tax effects. In many cases, EBIT is close to operating income. Interest expense is the total cost of borrowing. This includes interest paid on loans, credit lines, bonds, and other debt obligations. It doesn’t include principal repayments.
The formula works because it compares earnings available before interest with the interest the business must pay. A higher result means the company has more breathing room. A lower result means interest costs are taking up a larger share of earnings.
How to Calculate Interest Coverage Ratio in 3 Simple Steps
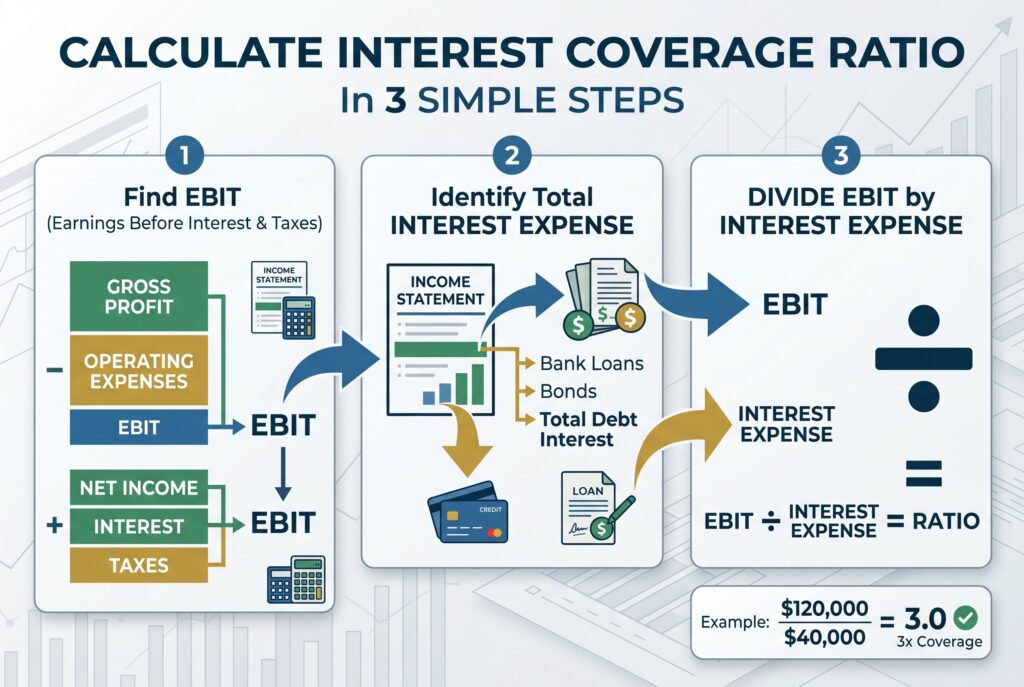
The first step is to find EBIT. If EBIT isn’t shown directly on your financial statement, you can estimate it by taking gross profit and subtracting operating expenses. You can also start with net income and add back interest and taxes.
The second step is to identify total interest expense. Look at the income statement or profit and loss statement. Make sure you include interest from all debt sources, not just one loan. The third step is to divide EBIT by interest expense.
Here’s a simple example. A company has $500,000 in revenue, $200,000 in cost of goods sold, and $180,000 in operating expenses. Its EBIT is $120,000. If annual interest expense is $40,000, the calculation is:
The company’s interest coverage ratio is 3.0, meaning it earns three times its annual interest obligation.
Interactive Interest & Cash Coverage Calculator
Interest Coverage Ratio Calculator
Enter revenue, cost of goods sold, operating expenses, and interest expense. The calculator will estimate EBIT and then calculate the interest coverage ratio automatically.
EBIT = Revenue − Cost of Goods Sold − Operating Expenses
Interest Coverage Ratio = EBIT ÷ Interest Expense
An interactive calculator should ask for EBIT, interest expense, depreciation, and amortization. With those numbers, it can show both the interest coverage ratio and the cash coverage ratio.
The interest coverage ratio uses EBIT divided by interest expense. The cash coverage ratio is more conservative in a different way because it adds back non cash expenses such as depreciation and amortization before comparing earnings power with interest expense. A calculator is useful because it shows how sensitive the ratio can be. If interest expense rises because of variable rate debt, the ratio can fall even when operating earnings stay flat. If EBIT declines during a slow quarter, the ratio can weaken quickly.
Interpreting the Results: What is a Good Ratio in 2026?
A ratio below 1.0 is a warning sign because the company doesn’t generate enough EBIT to cover interest expense. A ratio between 1.0 and 2.0 may still be risky because there isn’t much room for error. A ratio around 3.0 is often considered a reasonable benchmark. It suggests the business has enough earnings cushion to handle interest payments, though it still needs monitoring.
A ratio above 5.0 is generally stronger, especially for volatile businesses. Tech companies, startups, and cyclical companies may need a higher ratio because earnings can move sharply. Stable industries, such as utilities, may operate safely with lower ratios because revenue is often more predictable.
Interest rate sensitivity is important. Businesses with variable rate loans should watch this metric closely because rising interest expense can reduce coverage even if sales don’t change. A company that looked safe at a 4.0 ratio could become less comfortable if refinancing costs rise or debt resets at a higher rate.
ICR vs. Cash Coverage Ratio vs. DSCR
The interest coverage ratio focuses on EBIT and interest expense. It answers one narrow question: can operating earnings cover interest? The cash coverage ratio adjusts that view by adding back non cash expenses like depreciation and amortization. This can be useful because depreciation reduces accounting profit but doesn’t directly reduce cash in the current period.
The debt service coverage ratio, or DSCR, is broader. It compares cash flow with total debt service, including both interest and principal payments. This makes DSCR especially important for lenders who want to know whether a company can cover the full debt burden, not just interest.
The fixed charge coverage ratio, or FCCR, goes even further by including fixed obligations such as lease payments or rent. This is helpful for businesses with heavy property, equipment, or lease commitments. Each ratio has a different role. ICR is best for quick interest risk analysis. Cash coverage ratio gives a cash adjusted view. DSCR shows total debt repayment strength. FCCR helps when fixed costs extend beyond debt.
Conclusion
The interest coverage ratio is a simple formula, but it gives a powerful view of financial safety. It shows whether your business can cover interest expense with current operating earnings and how much cushion exists if conditions worsen.
To improve the ratio, a company can increase EBIT, reduce operating costs, refinance high interest debt, pay down debt, or improve pricing and margins. The goal isn’t just to reach a good number once. The goal is to build a stronger margin of safety over time. Run the calculation every quarter. If the ratio is improving, your debt position may be getting healthier. If it’s falling, act early before interest pressure turns into a cash flow problem.