

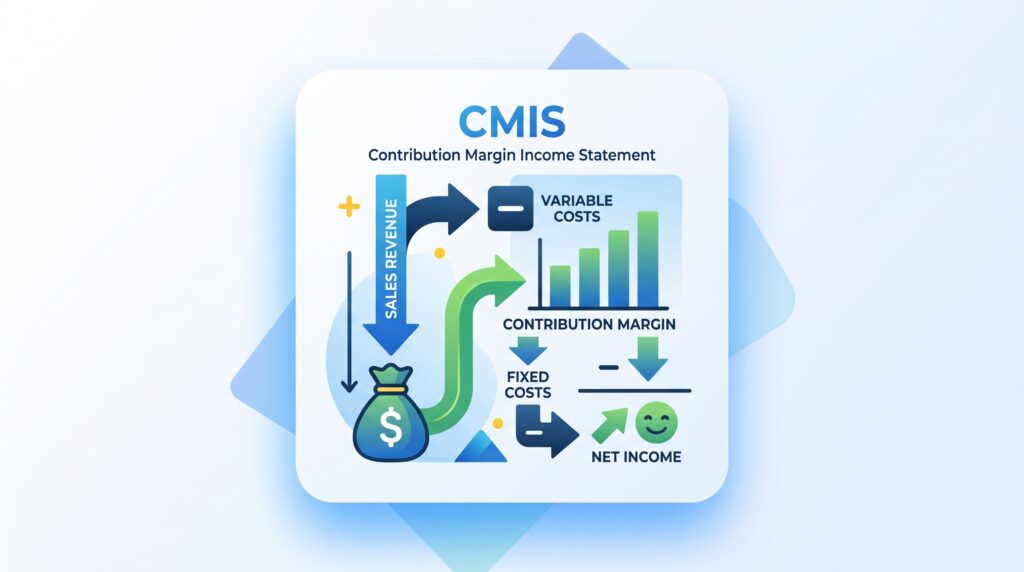
A contribution margin income statement helps businesses see profit more clearly by separating variable costs from fixed costs. Unlike a traditional income statement, this format focuses on cost behavior, not accounting categories. That makes it useful for pricing decisions, product profitability, break-even analysis, and internal management reporting. When operating costs can change quickly, this statement gives leaders a sharper view of what actually drives profit.
What Is A Contribution Margin Income Statement?
A contribution margin income statement is an internal financial report that shows sales revenue, variable costs, contribution margin, fixed costs, and net operating income. It helps managers understand how much revenue remains after variable costs are paid. The key idea is simple: contribution margin is the amount available to cover fixed costs and then create profit. If the contribution margin is too low, the business may struggle even when sales look strong. This statement is mainly used for internal decision-making. It isn’t usually the format used for external financial reporting, but it’s very useful for planning, pricing, and cost control.
Contribution Margin Formula
The basic contribution margin formula is:
Contribution Margin = Sales Revenue − Variable Costs
Variable costs are expenses that change with sales volume. These may include raw materials, packaging, direct labor, payment processing fees, fulfillment, sales commissions, or shipping tied to each order.
Fixed costs are expenses that stay relatively stable in the short term. These may include rent, salaries, insurance, depreciation, software subscriptions, and office costs. For example, if a company earns $200,000 in sales and has $90,000 in variable costs, its contribution margin is $110,000. That $110,000 then helps cover fixed costs. Whatever remains becomes operating profit.
Contribution Margin Income Statement Format
The contribution margin statement uses a different structure from the traditional income statement. Instead of grouping expenses by function, it groups them by behavior.
| Contribution Margin Income Statement Format |
| Sales Revenue |
| Less: Variable Costs |
| Contribution Margin |
| Less: Fixed Costs |
| Net Operating Income |
Here is a simple example:
| Item | Amount |
| Sales Revenue | $200,000 |
| Less: Variable Costs | $90,000 |
| Contribution Margin | $110,000 |
| Less: Fixed Costs | $70,000 |
| Net Operating Income | $40,000 |
This format shows that the company has $110,000 available to cover fixed costs. After paying $70,000 in fixed costs, it earns $40,000 in operating profit.
Traditional Income Statement Vs. Contribution Format Income Statement
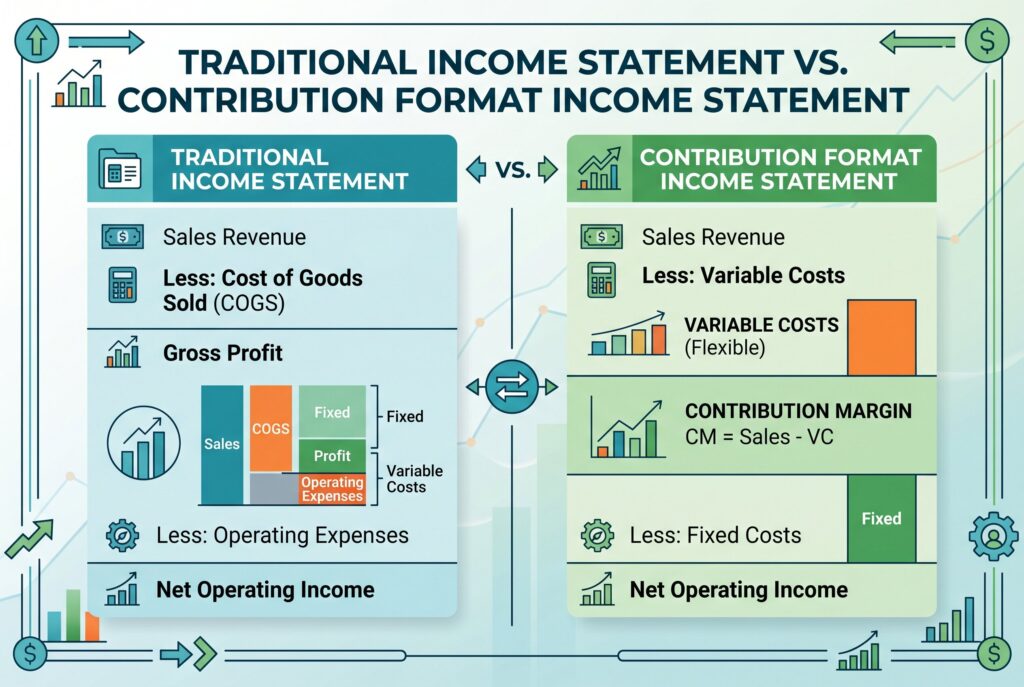
A traditional income statement separates expenses by function. It usually starts with sales, subtracts cost of goods sold, shows gross profit, then subtracts operating expenses to reach net income. A contribution format income statement separates expenses by behavior. It asks whether each cost is variable or fixed. This is the most important difference.
| Item | Amount |
| Sales Revenue | $200,000 |
| Less: Variable Costs | $90,000 |
| Contribution Margin | $110,000 |
| Less: Fixed Costs | $70,000 |
| Net Operating Income | $40,000 |
The traditional format is better for external reporting. The contribution format is better for internal decisions. It helps managers see how changes in sales volume affect profit. For example, a traditional report may show gross profit, but it may not reveal whether costs rise directly with each sale. The contribution format makes that clearer.
Contribution Margin Ratio
The contribution margin ratio shows contribution margin as a percentage of sales. The formula is:
Using the earlier example, contribution margin is $110,000 and sales revenue is $200,000. The contribution margin ratio is 55%. That means 55 cents of every sales dollar remains after variable costs. Those 55 cents help cover fixed costs and then become profit after break-even. This ratio is useful when comparing products, services, sales channels, or pricing strategies.
How To Prepare A Contribution Margin Statement
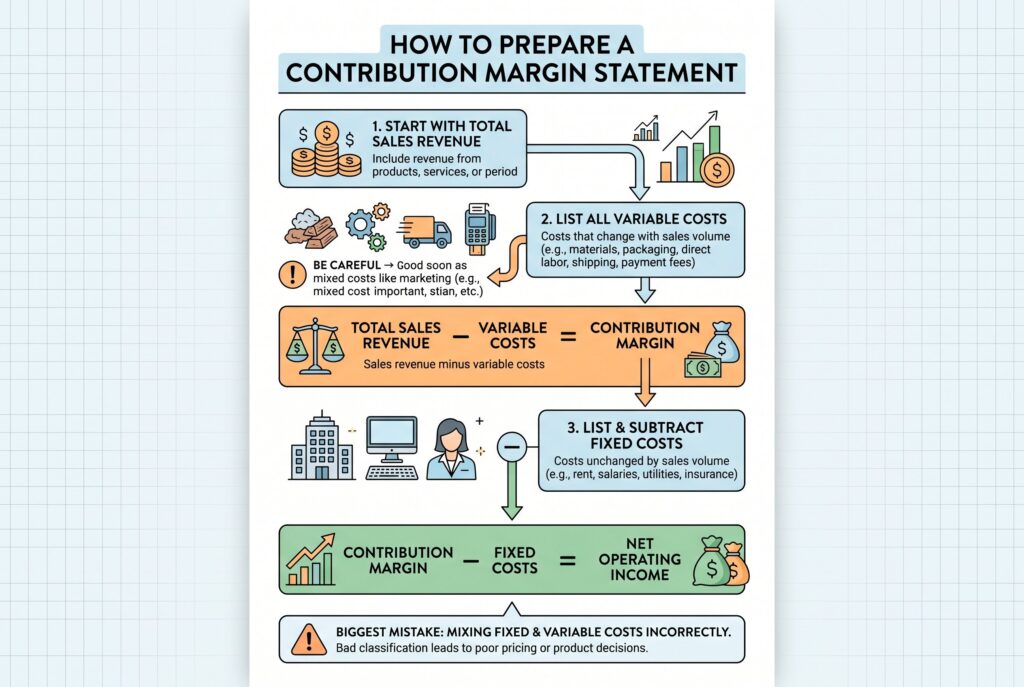
Start with total sales revenue. This should include the revenue from the product, service, or period you want to analyze. Next, list all variable costs. Be careful here. Some costs are easy to classify, such as materials or packaging. Others are more difficult, such as mixed labor, fulfillment, shipping, returns, payment fees, and marketing spend. Only include costs that truly change with sales volume.
Then subtract variable costs from sales revenue to calculate contribution margin. After that, list fixed costs and subtract them from contribution margin. The final result is net operating income. The biggest mistake is mixing fixed and variable costs incorrectly. If you classify costs badly, the statement may lead to poor pricing or product decisions.
Why Managers Use Contribution Margin Income Statements

Managers use contribution margin income statements because they make decision-making easier. The format can show whether a product is profitable enough to keep, whether a discount is safe, and how much sales must grow to cover fixed costs.
It also supports break-even analysis. The break-even formula is:
If fixed costs are $70,000 and the contribution margin ratio is 55%, break-even sales are about $127,273. Below that amount, the business loses money. Above it, the business begins generating profit. This is helpful for product launches, marketing campaigns, hiring plans, and pricing changes.
Common Mistakes To Avoid
Don’t assume gross profit and contribution margin are the same. Gross profit follows traditional accounting categories, while contribution margin focuses on variable costs. Don’t ignore semi-variable costs. Some expenses include both fixed and variable parts. For example, labor may include a fixed salary base plus variable overtime. Don’t use the statement as a replacement for official financial reporting. It’s a management tool, not a full external reporting format.
Conclusion
A contribution margin income statement gives businesses a clearer way to understand profit. It shows how much revenue remains after variable costs, how much is needed to cover fixed costs, and when profit begins. Use this format when reviewing pricing, discounts, product mix, cost control, or break-even targets. A traditional income statement shows whether the company made money. A contribution margin statement helps explain why.