


Descriptive vs inferential statistics is one of the first comparisons every data student, analyst, or business manager needs to understand. Knowing how to calculate data isn’t enough. You also need to know which statistical method helps you make the right decision. Descriptive statistics tells you what happened in the data you already have. Inferential statistics helps you estimate what may be true beyond that data.
What is the Core Difference?
Inferential vs descriptive statistics comes down to facts versus forecasts. Descriptive statistics summarizes known data. It describes what is already in front of you, such as last month’s sales, average customer age, or the click-through rate of a campaign.
Inferential statistics uses a sample to make predictions, estimates, or conclusions about a larger population. It helps answer questions you can’t measure directly, such as whether a new product design will increase future sales for all customers. Descriptive statistics answers: What does this dataset show? Inferential statistics answers: What can this sample suggest about a larger group?
What is Descriptive Statistics? Telling the Data’s Story
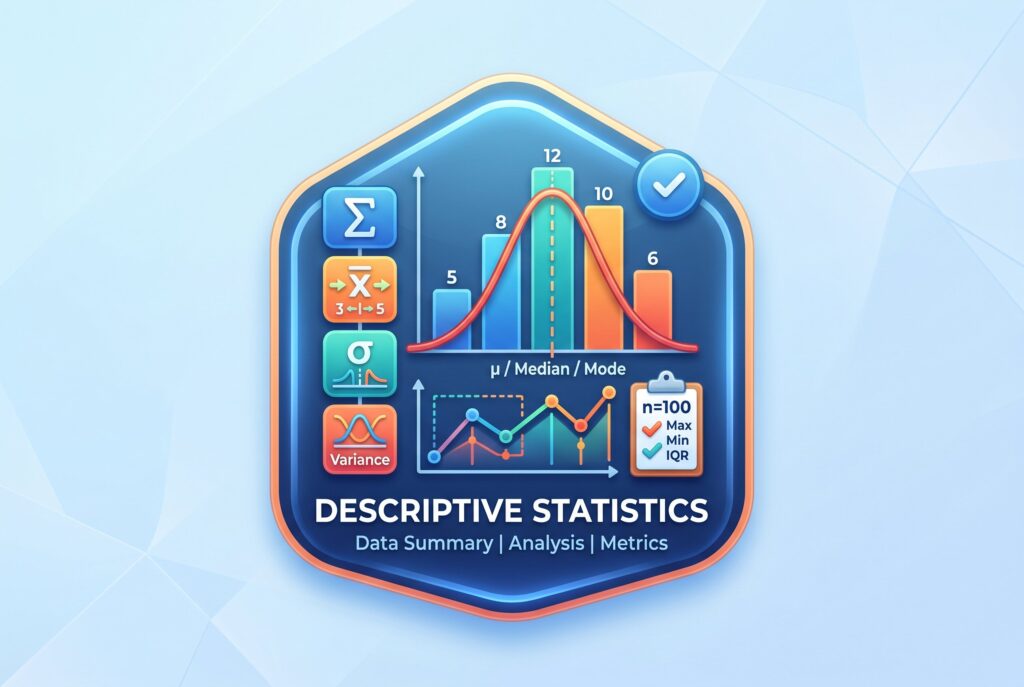
What is descriptive statistics? Descriptive statistics is the process of organizing, simplifying, and presenting raw data so it makes sense. It doesn’t try to predict the future. It explains the data you already collected. A clear descriptive statistics definition is this: descriptive statistics summarizes a dataset using numbers, tables, and charts. It helps you understand patterns, typical values, variation, and distribution.
The most common tools include measures of central tendency and measures of dispersion. Central tendency includes mean, median, and mode. The mean is the average. The median is the middle value. The mode is the most common value. Dispersion shows how spread out the data is. This includes range, variance, and standard deviation. If two companies have the same average revenue but one has much higher standard deviation, that company’s results are less stable. Descriptive statistics is useful because raw data is often too large or messy to read directly. A dashboard, table, or chart turns that mess into a readable story.
The Power of Summary Statistics

In business dashboards, descriptive statistics often appear as summary statistics. These are quick snapshots that leaders use before making decisions. Examples include total Q1 revenue, average order value, median delivery time, customer churn rate, average customer age, or monthly website traffic.
Summary statistics don’t explain every cause behind the numbers, but they show the current situation clearly. A CEO may first look at revenue growth, average margin, refund rate, and customer acquisition cost before deciding whether to expand a campaign. That’s why summary statistics are powerful. They reduce thousands of records into a few signals people can understand quickly.
What is Inferential Statistics? Making Data-Driven Predictions

Inferential statistics goes beyond the data you already have. It uses a sample to estimate, test, or predict something about a larger population. This matters because collecting data from everyone is usually impossible. A company can’t survey every potential customer. A hospital can’t test every patient in the world. A researcher can’t observe every future event. Instead, they collect a sample and use inferential methods to make reasonable conclusions.
Common inferential methods include t-tests, ANOVA, regression analysis, confidence intervals, and hypothesis testing. These tools help determine whether a pattern is likely meaningful or just random noise. For example, if an e-commerce company tests a new checkout page with 5,000 users, inferential statistics can help estimate whether the new design would increase conversions for future users too.
Interactive Tool: The Population vs. Sample Simulator
A population vs sample simulator should help users see the difference visually. The full population represents everyone or everything you want to understand. The sample represents the smaller group you actually measure. The tool could let users choose a population size, draw random samples, and compare the sample average with the true population average. As the sample size increases, users would usually see the estimate become more stable. This makes the key idea clear: descriptive statistics summarizes the sample you collected, while inferential statistics uses that sample to estimate what may be true for the larger population.
Real-World Descriptive Statistics Examples Across Industries

E-commerce
Descriptive statistics might show the average order value from last week’s holiday sale, helping the company understand what customers actually spent. Inferential statistics would go further by testing whether a new website layout is likely to increase sales for future customers.
Marketing
Descriptive statistics might report that an email campaign had a 4.2% click-through rate, providing a factual summary of campaign performance. Inferential statistics would test whether the subject line caused the increase or whether the result may have happened by chance.
Healthcare
Descriptive statistics might report the average blood pressure of 50 trial patients, summarizing current data. Inferential statistics would test whether a new treatment is likely to lower blood pressure for the broader patient population.
Education
Descriptive statistics might show the average test score for one class, reflecting current performance. Inferential statistics would estimate whether a new teaching method could improve scores across the whole school district.
The Golden Rule: Descriptive Analysis Always Comes First
Descriptive analysis should always come before inferential analysis. You can’t build reliable predictions if you don’t understand the data first. Before running advanced models, analysts check descriptive statistics to spot missing values, outliers, strange patterns, duplicate entries, or impossible numbers. For example, if a customer age column contains “300,” that error needs to be fixed before any serious inference happens.
Descriptive analysis also helps choose the right inferential method. If the data is highly skewed, contains outliers, or has a small sample size, certain tests may not be appropriate. In simple terms, descriptive statistics cleans the window. Inferential statistics looks through it.
Common Pitfalls When Choosing Your Statistical Method
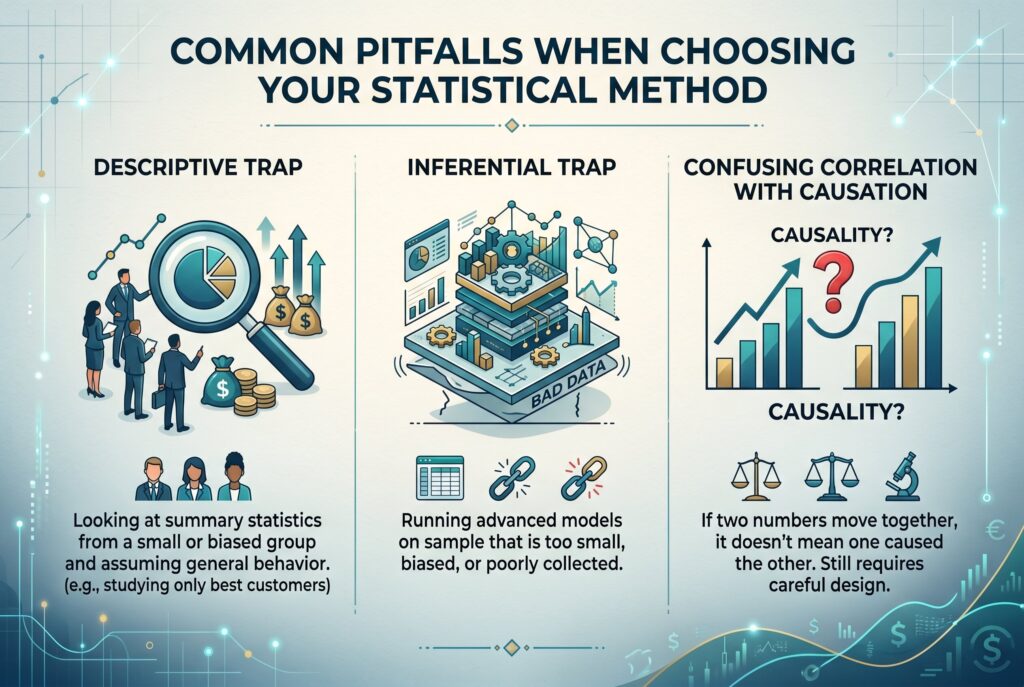
The first pitfall is the descriptive trap. This happens when someone looks at summary statistics from a small or biased group and assumes everyone will behave the same way. For example, studying your best 100 customers doesn’t automatically tell you how all future customers will act.
The second pitfall is the inferential trap. This happens when people run advanced models on a sample that is too small, biased, or poorly collected. A fancy regression model won’t fix bad data. The third pitfall is confusing correlation with causation. If two numbers move together, it doesn’t always mean one caused the other. Inferential statistics can help test relationships, but it still requires careful design and interpretation.
Conclusion
Descriptive statistics tells you what happened. Inferential statistics tells you what will likely happen or what may be true beyond your sample. You need both. Descriptive statistics gives you clarity. Inferential statistics gives you direction. Together, they help turn raw data into smarter decisions, better experiments, and more reliable forecasts.
