
Investors commit capital to businesses with the expectation of earning a return that compensates them for the risks they take. As market conditions, company performance, and investor expectations change, determining the appropriate return required by shareholders becomes a critical part of financial analysis. Understanding this required return helps businesses make better investment decisions, evaluate growth opportunities, and estimate the value of future cash flows. This is why the cost of equity plays a central role in corporate finance and stock valuation.
What Is the Cost of Equity?
The cost of equity definition has two sides. For investors, it is the minimum return they expect for taking the risk of owning shares. For a company, it is the return it must generate to justify using shareholder capital instead of safer funding sources.
The Standard Approach: CAPM Cost of Equity
The Capital Asset Pricing Model, usually called CAPM, is the most widely used method for estimating cost of equity. It links investor return expectations to market risk.
The formula is:
Cost of Equity = Risk Free Rate + Beta × Market Risk Premium
The risk free rate represents the return investors could earn from a very safe asset, usually a long term government bond.
Beta measures how volatile a stock is compared with the overall market. A beta of 1 means the stock tends to move with the market. A beta above 1 means the stock is more volatile. A beta below 1 means it is less volatile.
Market risk premium is the extra return investors demand for owning stocks instead of risk free assets.
Market Risk Premium (MRP) = Expected Market Return − Risk-Free Rate
For example, assume the risk free rate is 3%, beta is 1.2, and the market risk premium is 6%.
Cost of Equity = 3% + 1.2 × 6%
Cost of Equity = 10.2%
This means equity investors would expect roughly 10.2% per year to compensate them for the stock’s risk.
Why Beta Matters So Much
Beta is powerful because it translates business risk into investor expectations. A stable utility company may have a beta below 1 because earnings are predictable. A high growth technology company may have a beta above 1 because profits are more uncertain.
However, beta isn’t perfect. It is based on historical stock price behavior, so it can change when the company’s business model, leverage, industry, or market conditions change. That is why analysts should not copy beta blindly. They should ask whether the historical number still reflects the company’s future risk.
The Alternative: Dividend Capitalization Model
The dividend capitalization model, also called the dividend growth model, is useful for mature companies that pay stable and growing dividends.
The formula is:
D1 is the expected dividend next year.
P0 is the current stock price.
g is the expected dividend growth rate.
For example, if a company is expected to pay a $2 dividend next year, its current share price is $40, and dividends are expected to grow 4% per year, then:
Cost of Equity = ($2 / $40) + 4%
Cost of Equity = 5% + 4%
Cost of Equity = 9%
This model is simple, but it has a major limitation. It does not work well for startups, high growth companies, or firms that do not pay dividends. In those cases, CAPM is usually more useful.
How to Calculate Cost of Equity for Private Companies
Using the Pure Play Method
The pure play method is a common way to estimate the cost of equity for a private company. Since private businesses don’t have publicly traded shares, analysts use comparable public companies with similar operations and risk profiles. By examining the market data of these peers, they can estimate a beta that reflects the private company’s risk. That beta can then be used in the CAPM formula to calculate the cost of equity. Because it relies on observable market data, the pure play method is widely used in business valuations and private equity transactions.
Using the Build-Up Method
When suitable comparable public companies aren’t available, analysts often use the build-up method. Instead of relying on beta, this approach estimates the required return by adding risk premiums to a risk-free rate. Common adjustments include the equity risk premium, size premium, industry risk premium, and company-specific risk premium. Because it doesn’t require publicly traded shares or market-based beta estimates, the build-up method is particularly useful for small businesses, startups, and family-owned companies.
Cost of Equity vs Cost of Debt
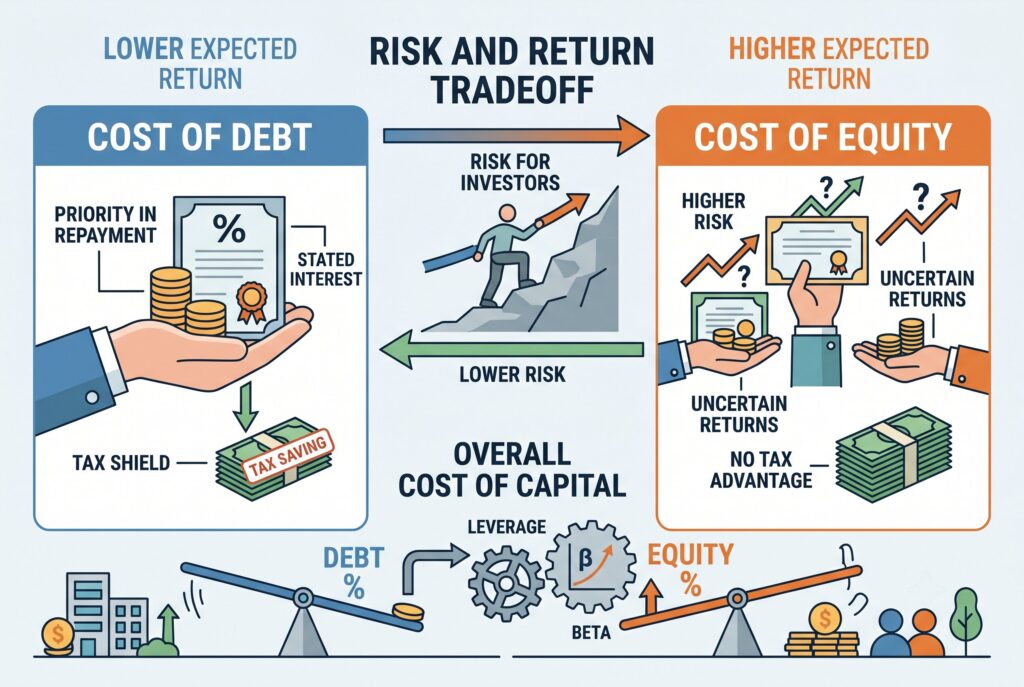
| Factor | Cost of Equity | Cost of Debt |
| Risk Level | Higher because shareholders are the last to be paid if a company fails | Lower because lenders have priority over shareholders |
| Expected Return | Investors typically require a higher return for taking ownership risk | Lenders receive a fixed interest rate |
| Payment Priority | Paid after all creditors and debt holders | Paid before shareholders |
| Tax Treatment | Dividends aren’t tax deductible | Interest expense is usually tax deductible |
| Impact on WACC | Generally increases the company’s overall cost of capital | Can reduce WACC due to the tax shield |
| Effect of Higher Leverage | Excessive debt can increase financial risk and raise the cost of equity | More borrowing may increase borrowing costs if risk rises |
Cost of Equity, Cost of Capital, and WACC
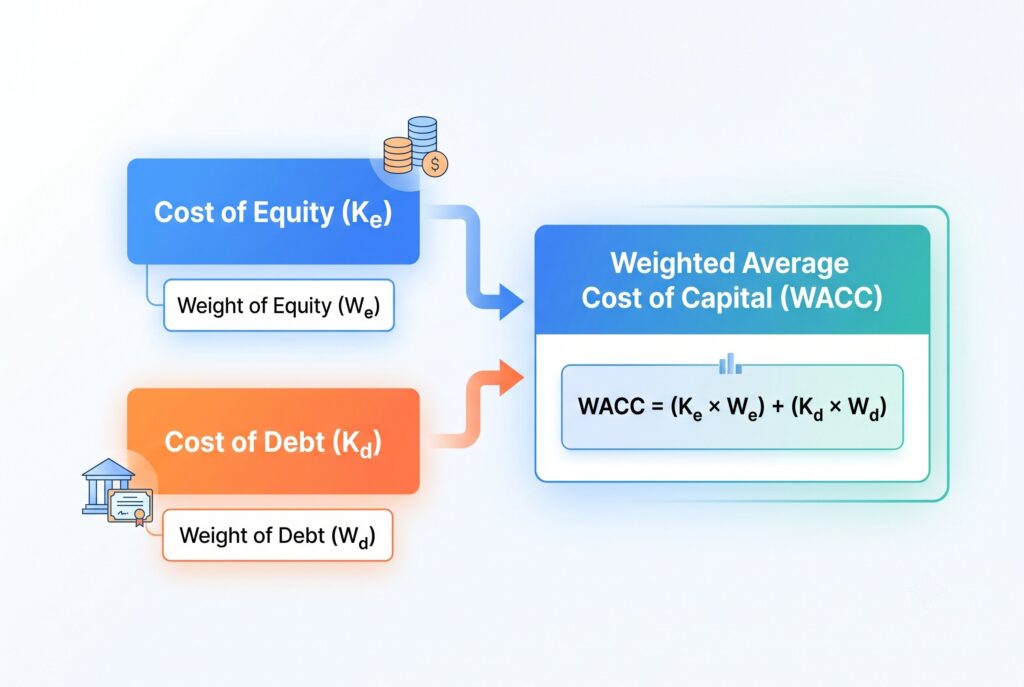
Cost of equity is one part of cost of capital. Cost of debt is the other major part. When a company uses both debt and equity, analysts combine them into WACC, or weighted average cost of capital.
WACC is used to value the entire company, especially when discounting unlevered free cash flow. Cost of equity is used when valuing only the equity portion, such as when discounting levered free cash flow to equity. This distinction matters. Using the wrong discount rate can overvalue or undervalue a company.
Why Cost of Equity Matters for Equity Financing
For founders and CFOs, equity financing may feel attractive because it does not require monthly loan payments. But it can still be expensive. When investors provide equity, they expect ownership upside. If they require a 20% return, that expectation becomes the company’s cost of equity. A project that earns only 10% may look profitable in accounting terms, but it may fail to satisfy investor expectations. That is why cost of equity is a hurdle rate. It helps leaders decide whether to launch a product, expand locations, accept outside investors, or use debt instead.
Conclusion
Cost of equity isn’t just a finance formula. It is a measure of trust, risk, and investor expectations. CAPM gives analysts a structured way to estimate return requirements. The dividend capitalization model works for stable dividend payers. Private companies may need build up methods or adjusted comparable company beta. Whether you are valuing a stock, raising equity financing, comparing cost of debt, or building WACC, the goal is the same: make sure the expected return is high enough to justify the risk.