
Net worth is one of the clearest ways to measure financial progress. It’s the value of what you own, your assets, minus what you owe, your liabilities. It isn’t your salary, monthly cash flow, or how impressive your lifestyle looks. It’s a financial snapshot.
According to Federal Reserve Survey of Consumer Finances data, the median net worth for American households is about $192,900, while the average household net worth is about $1,063,700. That large gap is why average net worth by age can be misleading. A small number of very wealthy households can pull the average far above what a typical family experiences.
Median vs. Average Net Worth: What’s the Difference?
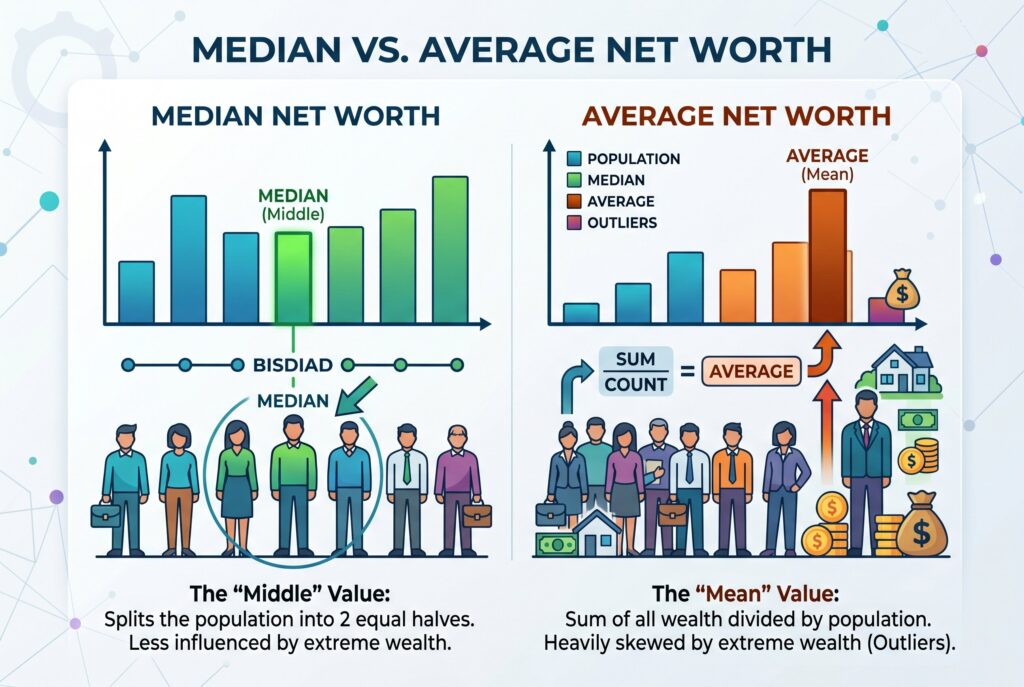
Understanding the difference between median and average net worth is important. Average net worth is calculated by adding all household wealth together and dividing by the number of households, but it can be heavily influenced by the wealthiest people.
Median net worth represents the middle household, with half of households having more and half having less. Because of this, median net worth is often a more realistic benchmark for most people. If the average seems much higher than expected, it may reflect wealth concentration rather than the financial reality of a typical household.
The Data: Average and Median Net Worth by Age
Net worth by age usually rises over time because people spend decades saving, investing, paying down debt, and building home equity. Younger households often have lower or negative net worth because they are early in their careers and may still carry student loans.
A simplified benchmark table may look like this:
| Age group | Median net worth | Average net worth |
| Under 35 | Lower, often early-stage | Pulled up by high earners |
| 35–44 | Growing through home equity and retirement savings | Higher but uneven |
| 45–54 | Stronger wealth-building years | Often sharply higher |
| 55–64 | Peak earning and pre-retirement years | One of the strongest groups |
| 65–74 | Retirement assets and home equity matter | Often near peak wealth |
| 75+ | Wealth may decline as assets are spent | Still varies widely |
What is considered middle age? In many financial discussions, middle age is often treated as roughly 45 to 64. This stage is important because earnings, retirement contributions, home equity, and investment growth may all be working at the same time.
Interactive Tool: Net Worth by Age Percentile Calculator
Net Worth by Age Percentile Calculator
Use this calculator to estimate your net worth and compare it with an age-group benchmark. Add your assets, subtract your liabilities, then compare the result with editable percentile thresholds. The goal is not to obsess over an exact rank, but to understand your financial trend over time.
Age Group
Assets
Liabilities
Editable Age-Group Percentile Benchmarks
Net Worth = Total Assets − Total Liabilities
Total Assets = Cash + Brokerage + Retirement + Real Estate + Vehicles + Business Equity + Other Assets
Total Liabilities = Mortgage + Student Loans + Credit Cards + Car Loans + Taxes Owed + Personal Loans + Other Liabilities
Percentile Range = Net Worth compared with selected age-group benchmark thresholds
Note: Percentile thresholds are editable because benchmark sources, household definitions, survey years, and age bands can differ. Replace the default thresholds with your preferred dataset if you need publication-level accuracy.
A net worth by age percentile calculator helps answer the deeper question behind the search: “How do I compare with people my age?” To estimate your percentile, calculate your total assets, subtract total liabilities, then compare your result with your age group. Your average total assets may include cash, savings, brokerage accounts, retirement accounts, real estate, vehicles, and business equity. Your liabilities may include mortgages, student loans, credit cards, car loans, taxes owed, and personal loans. The goal is to understand whether your financial trend is improving. A household at the 40th percentile today can move upward over time by saving consistently, reducing debt, and investing early.
Are You Ahead? Net Worth by Age Percentile Tiers
Percentile rankings are useful because they show where your net worth stands compared with peers. Top 25%, Top 10%, and Top 1% households usually have very different financial structures. Top 25% households often have steady retirement savings, manageable debt, and growing home equity. Top 10% households may hold larger investment portfolios, higher home equity, business ownership, or multiple income sources. Top 1% households usually have significant investable assets, business equity, real estate, and tax-advantaged planning strategies.
The key difference isn't only income. A high-income household can still have weak net worth if spending, debt, and lifestyle inflation absorb everything. A moderate-income household can build strong wealth by saving early and avoiding expensive debt.
Wealth Building Checkpoints: Are You on Track?
In your 20s and 30s, the biggest goal is momentum, and maybe you often think about how much money should I have saved by 30, a practical target is to have an emergency fund, little high-interest debt, and a retirement habit already started. For how much should I have in my 401(k) at 30, you should begin by contributing enough to capture your employer match, then increase the percentage over time.
In your 40s and 50s, the focus shifts to acceleration. These years often bring higher income, but also higher pressure: housing, children, college costs, aging parents, and retirement planning. This is when your savings rate matters deeply.
In your 60s, the question changes. People begin asking can I retire at 60, what is the best age to retire, and whether their assets can support their desired average retirement income. At this stage, your net worth should become more than a number. It should become a plan for reliable cash flow, healthcare costs, taxes, housing, and longevity.
3 Steps to Boost Your Future Net Worth
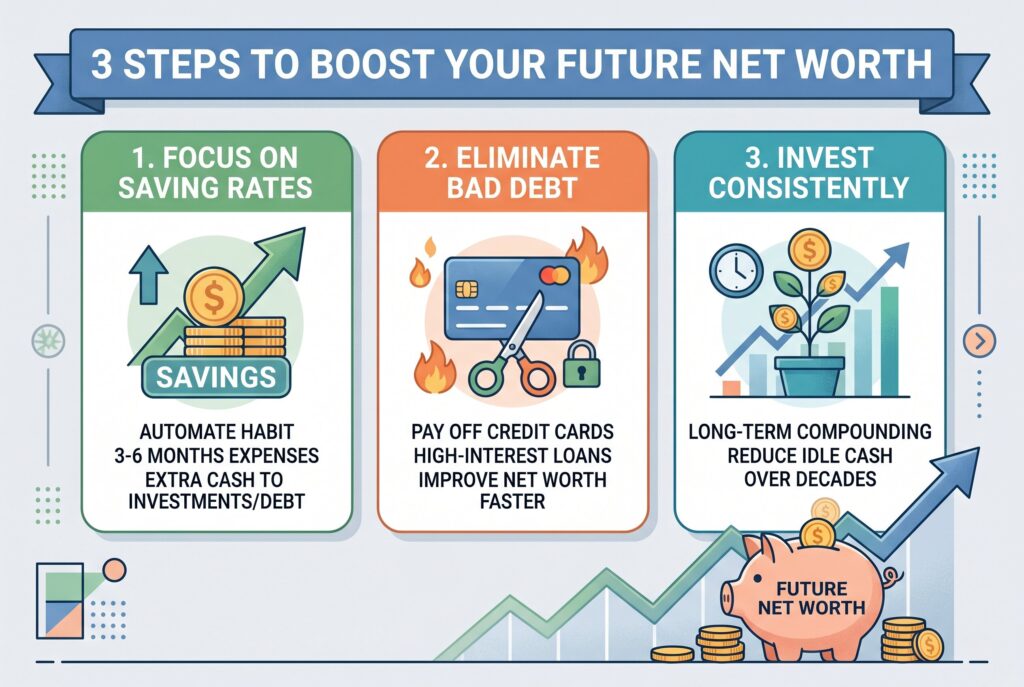
- First, prioritize building financial resilience before chasing wealth. A strong emergency fund gives you options when life becomes unpredictable. It prevents temporary setbacks from turning into long-term financial damage and creates the stability needed to invest with confidence.
- Second, treat high-interest debt as a barrier to wealth creation. Every dollar spent on excessive interest is a dollar that cannot be invested, saved, or used to improve your future. Eliminating expensive debt often provides one of the highest guaranteed returns available.
- Third, focus on long-term investing rather than short-term market movements. Wealth is rarely built through perfect timing. It is usually the result of consistent contributions, patience, and the power of compounding over many years. The earlier you invest and the longer you stay invested, the more time your money has to work on your behalf.
- Finally, remember that net worth grows from habits more than income. Earning more can help, but regularly saving, investing, and making thoughtful financial decisions are what create lasting wealth over time.
Conclusion
Your net worth isn’t a reflection of who you are. It doesn’t measure your intelligence, work ethic, or potential for success. It simply shows the difference between what you own and what you owe at a specific moment in time. If your net worth is negative because of student loans, a mortgage, or debt from the early stages of your career, that doesn’t mean you’re falling behind. Many people begin their financial journey in the same position. What matters is whether you're making progress year after year.
Instead of comparing yourself to everyone else, focus on the trend. Are your assets growing? Are your debts shrinking? Are you in a stronger financial position than you were a year ago? Those are the questions that matter most. Benchmarks like average and median net worth by age can provide useful context, but they should never define your success. The most meaningful comparison is between where you are today and where you were yesterday. Over time, consistent progress matters far more than any single number.